
- Ethereum dropped by 1.61% to $2,960 as Foundation offloads over 11,000 ETH, raising concerns about internal sentiment.
- Despite sell pressure, ETH remains above its 50- and 200-day moving averages, signaling trend strength and momentum.
- RSI above 70 and MACD strength show bullish momentum, but profit-taking risk could drive ETH down to $2,880 support.
Ethereum’s recent volatility has increased as its price dropped to $2,960 on July 12, down by 1.61% in 24 hours. Despite this, ETH remains up 17.3% over the week and 6.75% over the month. The latest selling pressure emerged shortly after a wallet linked to the Ethereum Foundation moved 1,206.7 ETH, worth $3.61 million, through Uniswap.
A day earlier, the same foundation sold 10,000 ETH to SharpLink Gaming at a discount of 16% to market value. These transactions, coupled with technical exhaustion signals, have added uncertainty to Ethereum’s short-term price outlook.


Ethereum Foundation Transactions Intensify Bearish Pressure
The Ethereum Foundation’s back-to-back transactions raised fresh concerns across the market. The discounted off-market sale on July 11, followed by the Uniswap dump, introduced doubts about internal outlook.
These moves came after Ethereum posted an 83% rally over the past 90 days, leading to fears of strategic profit-taking. The market responded quickly. Selling pressure increased as these transfers were confirmed, especially with broader altcoin weakness deepening.
The Altcoin Season Index declined by 3.45% on the week to 28, placing the sector in neutral levels. That drop showed fading risk appetite and reduced demand for non-Bitcoin assets like ETH.
Technical Indicators Show Short-Term Exhaustion
Ethereum’s technical setup shows a strong trend that began in mid-June. The price broke out from the $2,200–$2,700 accumulation range, moving above resistance at $2,800. Trading volume increased to 3.48K, strengthening the bullish breakout.
However, RSI rose to 71.78, pushing ETH into the overbought levels. With RSI now above 70, the asset faces growing risk of profit-taking. A further rise toward 75 may prompt a correction.
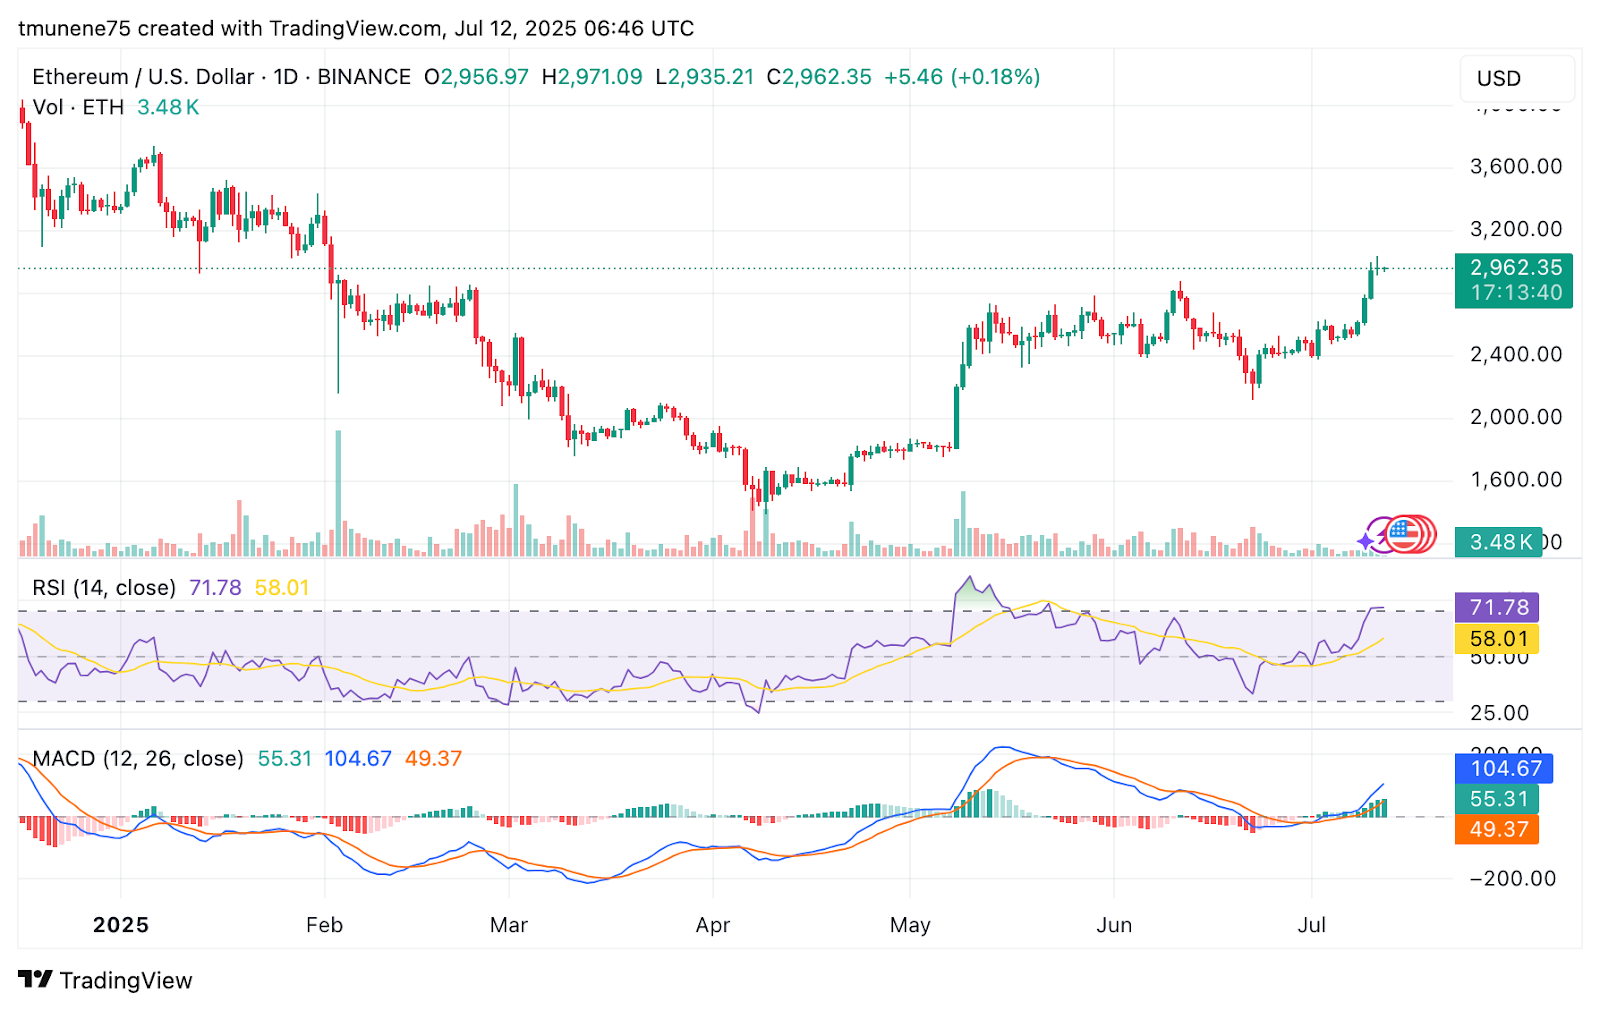
Meanwhile, the MACD indicator remains bullish, with its line at 104.67 versus a signal line of 49.37. The bullish crossover that formed in early July continues to support upward movement.
Network Activity and Moving Averages Show Strength
Ethereum’s price now trades above both its 50-day and 200-day moving averages, at $2,659 and $2,544 respectively. This positioning confirms recent trend strength and suggests market momentum remains intact.
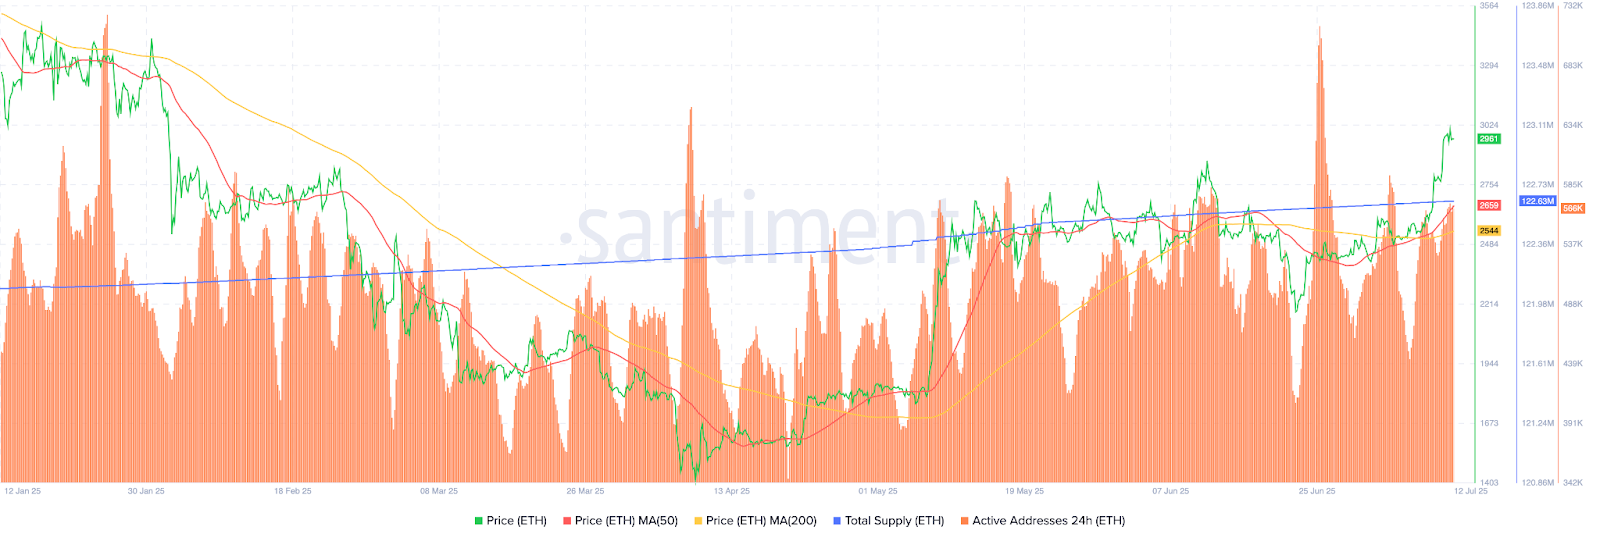
Active addresses spiked to 586,000, their highest in months, indicating growing network engagement. Ethereum’s turnover ratio fell to 0.0874, suggesting thinner liquidity, which may amplify short-term volatility. While Bitcoin’s dominance rose slightly to 63.78%, a sign of altcoin fatigue, Ethereum’s staking and ETF interest remain key demand drivers to monitor.
July 13 Price Scenarios
If momentum continues and address activity holds, Ethereum could push toward resistance at $3,050–$3,100. However, if short-term exhaustion escalates, it may retrace to support near $2,850–$2,880.
Ethereum’s short-term movement depends on how markets absorb the Foundation’s recent sell-offs and the current overbought technicals. While network strength and trend indicators support the upside, reduced altcoin demand and investor caution could weigh on prices.
ETH remains on track to test either the $3,100 resistance or fall back to $2,880, based on momentum sustainability and broader market dynamics.


