
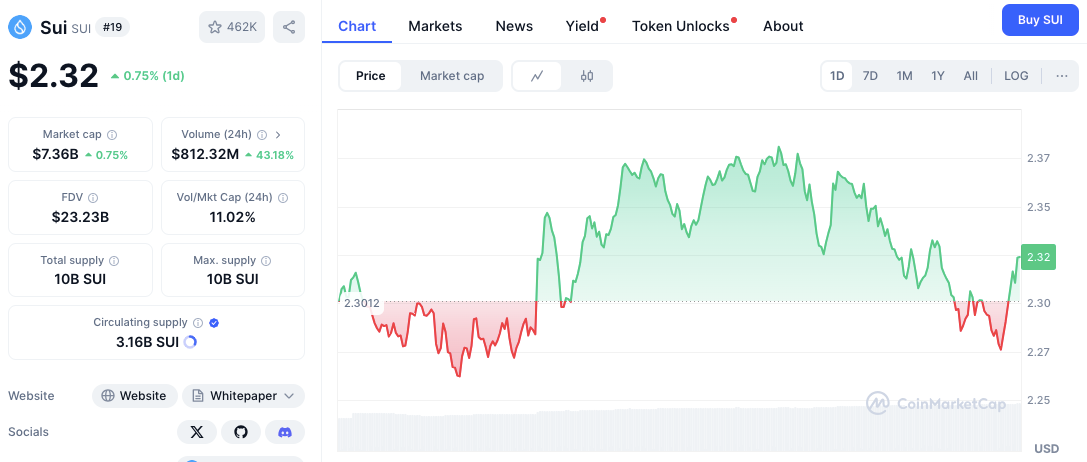
- SUI faces strong resistance at $2.37, while $2.30 acts as a key support level.
- RSI at 41.64 suggests bearish momentum, but a rebound remains possible.
- MACD signals easing selling pressure, hinting at a potential bullish reversal.
The Sui (SUI) token has seen dynamic price movement in recent sessions, with notable fluctuations shaping its short-term trajectory. As of press time, SUI trades at $2.32, reflecting a 1.07% increase over the past 24 hours. Traders are closely monitoring its price behavior, particularly around critical support and resistance levels, which could determine its next move.
Recent Price Movements
Recently, SUI exhibited a mixed trend, initially entering a bearish phase before gaining momentum. The price dipped into the red zone but swiftly rebounded into the green region.


After reaching a peak near $2.37, the token faced resistance and pulled back slightly. However, it is currently rebounding, indicating that bullish sentiment may still be present.
Key Support and Resistance Levels
The support level around $2.30 has proven significant, as price action shows multiple instances of recovery from this point. Conversely, resistance at $2.37 has consistently capped further gains, making it a critical level to watch. A decisive breakout above this level could open the door for further upside movement. If the price fails to hold above $2.30, it may decline further towards $2.25, signaling additional retracement.
Technical Indicators Analysis
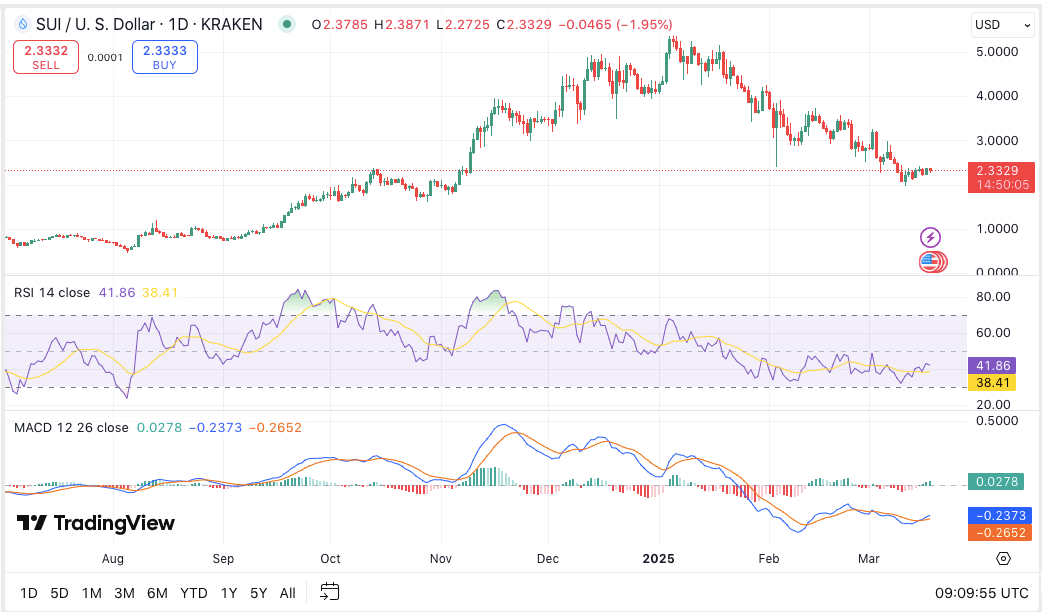
The Relative Strength Index (RSI) currently stands at 41.64, with its signal line at 38.39. The RSI remains below the neutral 50 mark, suggesting that bearish momentum persists. However, with levels approaching the oversold territory near 30, there is potential for a bounce if RSI climbs above 50. This shift could indicate strengthening bullish momentum.
The Moving Average Convergence Divergence (MACD) also reflects the ongoing market sentiment. The MACD line sits at 0.0272, while the signal line remains at -0.2381, with a histogram value of -0.2653.
While the MACD remains in negative territory, the shrinking histogram suggests that selling pressure is easing. If this trend continues, a reversal could be imminent, further supporting a potential upward movement.


