
- XRP struggles below $2.22 resistance, reflecting bearish momentum and selling pressure.
- Critical support at $2.10 and $2.00 may be tested if bearish momentum persists.
- Rising volume, RSI at 40.28, and negative MACD histogram indicate bearish dominance.
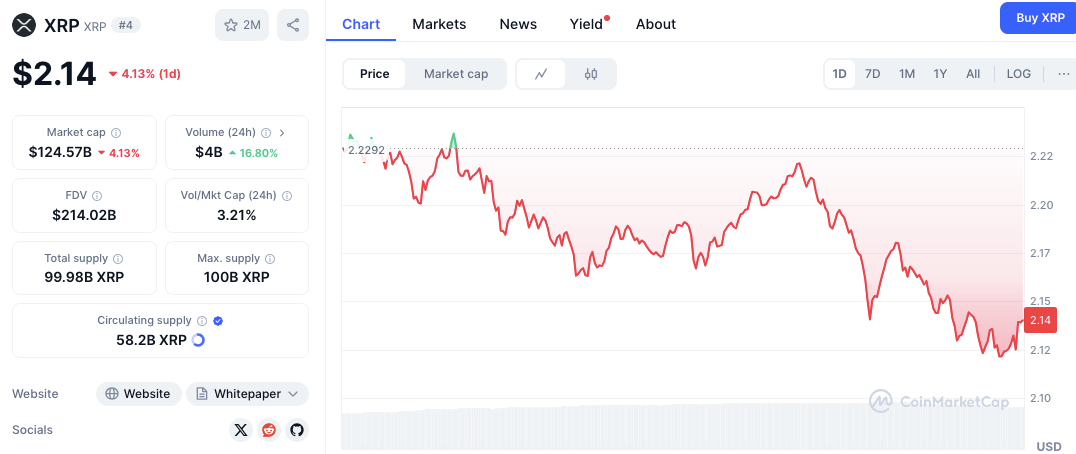
XRP’s recent price movements reflect a challenging environment as bearish momentum weighs heavily on the cryptocurrency. The price has declined to $2.13, marking a 4.16% drop over the past 24 hours.
The price chart shows a clear descending trend, with lower highs and lower lows indicating intensified selling pressure. Moreover, XRP recently faced a steep fall after failing to maintain strength above the $2.22 resistance.


Price Trend and Resistance Levels
XRP’s price action reveals a volatile decline, exacerbated by bearish momentum. The failure to hold above the $2.22 resistance zone triggered a notable sell-off. Consequently, this level now acts as a key barrier, preventing upward movement.
Additional resistance lies between $2.20 and $2.18, where several minor rejections occurred as XRP attempted to stabilize. If buyers manage to regain control, breaking above $2.22 could open the path toward $2.25 or higher. However, without sustained bullish volume, these levels may remain difficult to surpass.
Support Levels and Potential Downside
The current price trend also highlights critical support levels. The $2.10 mark has emerged as a vital support zone, where the price showed partial rebounds during recent dips.
However, continued bearish momentum could test stronger support at $2.00, which serves as a psychological threshold for market participants. A break below this level may intensify selling pressure, potentially driving XRP further downward.
Volume, RSI, and MACD Insights
Trading volume has risen by 17.22% in the past 24 hours, reflecting heightened market activity. However, the accompanying price decline suggests increased selling pressure, possibly from profit-taking or growing bearish sentiment.
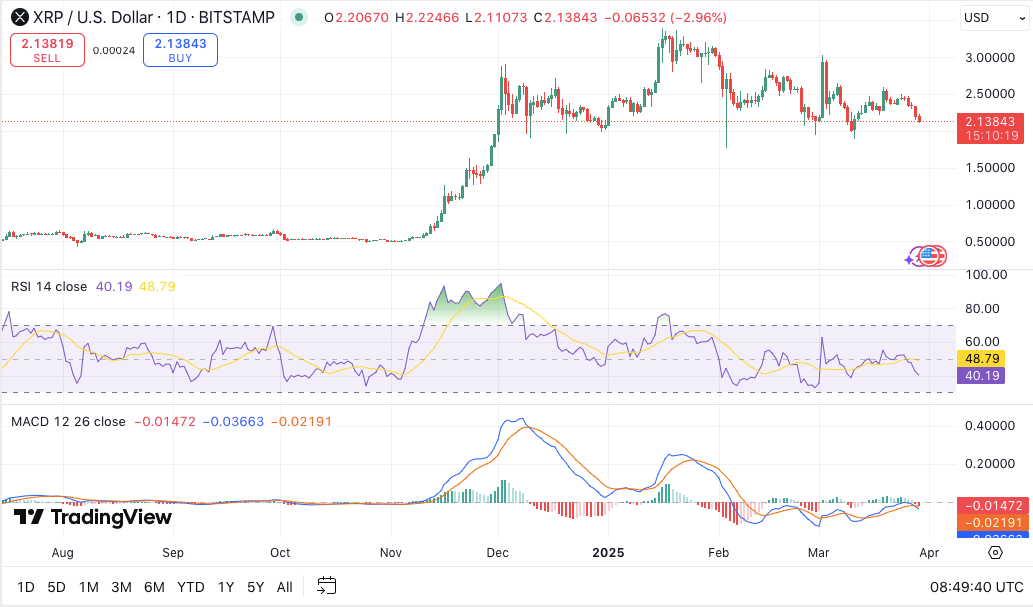
The Relative Strength Index (RSI) stands at 40.28, indicating that XRP is approaching the oversold territory. If RSI drops below 30, it could confirm oversold conditions. Conversely, a rebound above 50 could signal renewed buying interest and potential price recovery.
MACD analysis further supports the bearish outlook. The MACD line remains below the signal line, while the histogram is in the negative zone, signaling waning buying momentum. A bullish crossover in the MACD could indicate trend reversal, but current indicators suggest bearish dominance.


