- XCN’s 74.82% surge signals strong buying momentum and investor confidence.
- Key support at $0.01700–$0.01750, while resistance near $0.02280 limits gains.
- RSI at 77.13 suggests potential pullback, but MACD signals continued bullish pressure
Onyxcoin (XCN) has soared by 111%, leaving traders and investors buzzing with speculation. The cryptocurrency, which was hovering near $0.01218 just days ago, now sits at $0.02138, reflecting a dramatic shift in market sentiment. With a daily performance spike of 74.82%, the sharp rally has turned heads across the crypto space.
Market Sentiment and Trend Outlook
The recent rally isn’t just a random spike it’s backed by volume. A noticeable increase in trading activity has accompanied the price move, hinting at strong buying pressure. Significantly, this volume surge has added weight to the current trend, suggesting that the breakout may not be a flash in the pan.


The price chart shows a sharp upward trajectory, particularly during the latter part of the observed timeframe. This could mean that investors are gaining confidence, possibly due to new developments or growing project interest.
Key Price Zones: Support and Resistance
Strong support can be found in the $0.01700 to $0.01750 range, where the price recently consolidated before the breakout. Below that, $0.01500 serves as another anchor zone, while the lowest observed level at $0.01218 could act as a safety net during major corrections.

On the resistance side, $0.02180 presents the first hurdle, having acted as a mini-peak during the latest run. More importantly, the $0.02250–$0.02280 region appears to be a short-term ceiling. A break above $0.02300 could pave the way for a move toward the psychological $0.025 mark.
Technical Indicators Hint at Momentum
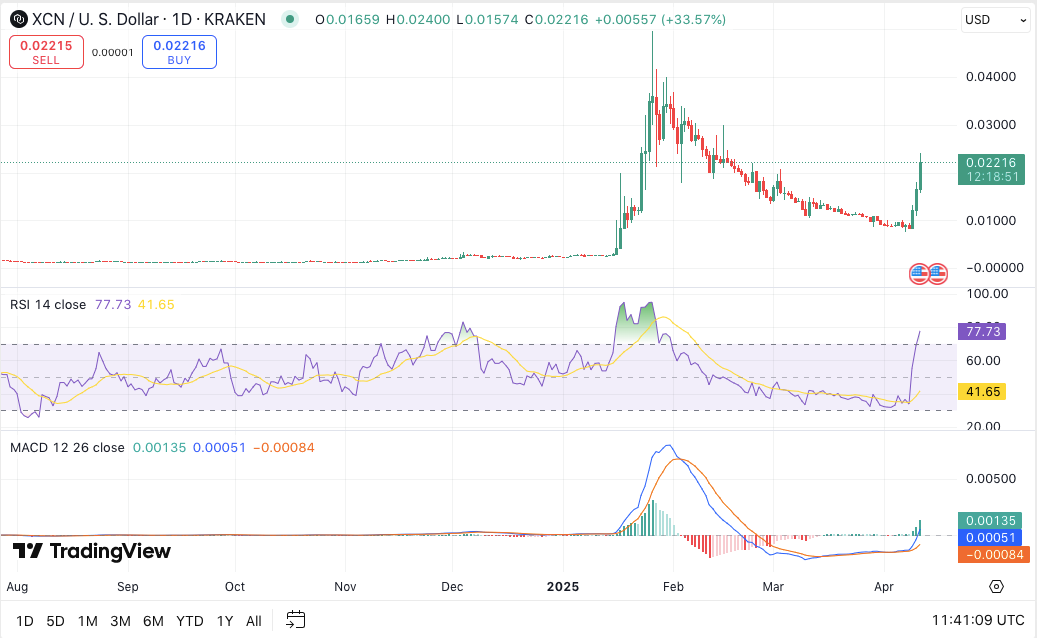
From an indicator perspective, the RSI sits at 77.13 well within the overbought territory. This suggests that while momentum remains strong, a short-term correction is possible as traders may take profits. However, the MACD paints a bullish picture. A positive crossover and a growing histogram both highlight increasing upside pressure.


