
- VeChain hovers near key support as traders await confirmation of bullish reversal.
- Historical patterns hint at a major rally if $0.025 support holds through May.
- Weak momentum persists, but fading bearish pressure may signal a shift in trend.
VeChain (VET) is at a critical juncture as the market anticipates its next move. The token as of press time is trading around $0.02783, registering a modest 2.23% gain in the past 24 hours. Despite the short-term uptick, VET has lost over 7% in the last week.
While price action appears muted, analysts ChartNerd believe that VET may be mimicking its past cycle behavior. If true, the asset could soon complete a final downward move before surging towards key Fibonacci targets.


The forecast points to a potential rise toward the $0.69 to $1.80 range if historical patterns repeat. While this outlook is bullish, a lot hinges on near-term support holding firm.
Market Structure and Historical Context
VeChain reached its all-time high above $0.25 in early 2021 during the crypto bull run. Since then, the price has undergone a significant correction, slipping into a prolonged bearish phase. From 2023 onward, the price has mostly moved sideways, suggesting a potential base formation.
Recent trading action has stayed within the $0.020 to $0.030 range, reflecting low volatility and uncertain sentiment. The $0.025 level has acted as short-term support in early 2025. If this level holds, it could set the stage for a new leg upward. However, a break below might lead to a retest of the stronger $0.018 support zone.
Indicators and On-Chain Observations
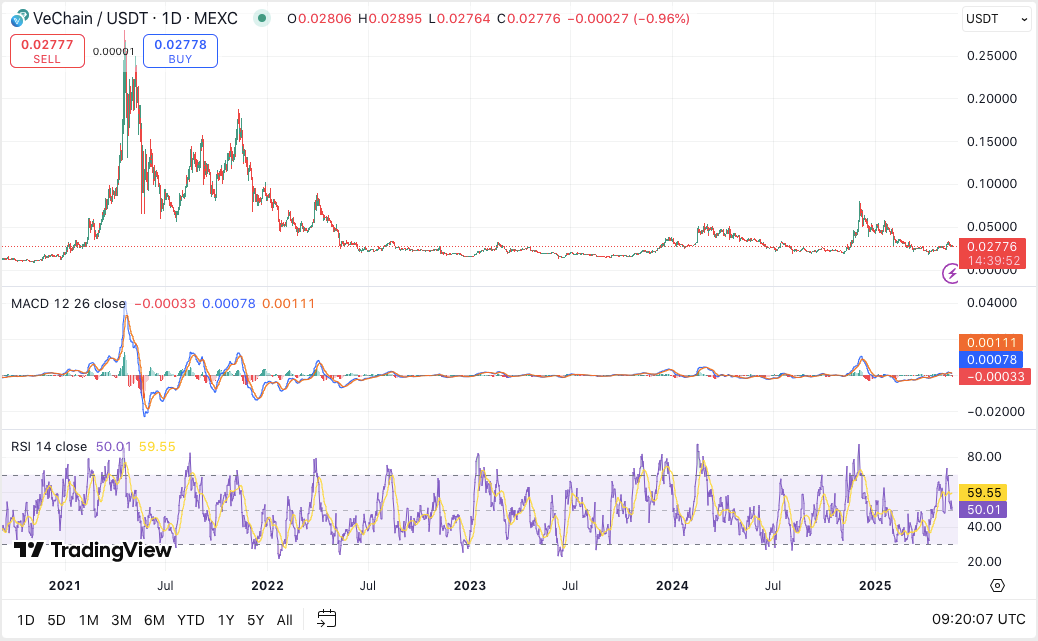
The technical indicators reflect a neutral stance. The MACD is marginally positive but hovering near the zero line. This indicates weak bullish momentum, though the histogram shows fading bearish pressure.
Meanwhile, the RSI is at 50.74, right in neutral territory. It recently tested the 59 level, hinting at some buying interest. Despite this, there’s no strong signal yet of an immediate trend reversal.
Looking at on-chain activity, VET’s inflow and outflow patterns have remained subdued since January. A notable exception was the $20 million inflow in December, which preceded a brief spike to $0.085.
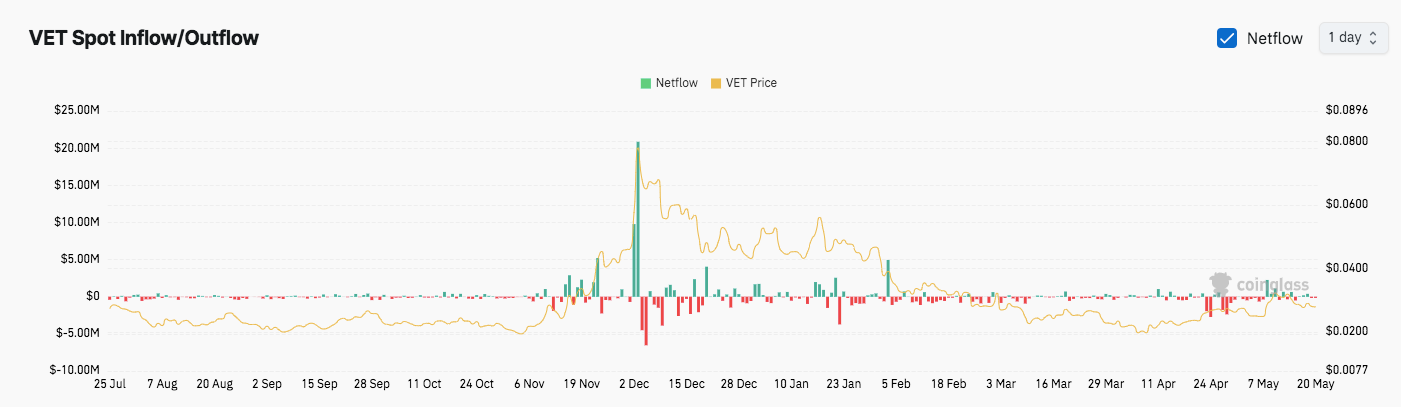
Following that, capital outflows triggered a retracement. Since then, both volume and volatility have been low, suggesting a wait-and-see approach among investors.
Near-Term Outlook
For May 21, VET traders should watch the $0.025 support level closely. If it holds, a bounce toward $0.035 is possible. However, a breakdown could send the price toward $0.018.
Meanwhile, a decisive break above resistance might mark the beginning of a new bullish leg. While historical patterns suggest a rally may be on the horizon, confirmation is needed through volume and trend strength.


