- Wave 2 ended near $2.60; Wave 3 likely underway, with Fibonacci targets at $5.74, $10.50, and up to $14.35 if momentum persists.
- Price breakout above $3.64 with 7.85M volume confirms trend strength; $4.11 is key resistance before potential move to $5.00.
- MVRV Z-Score at 69.87 signals potential for growth; breakout above $3.40 confirms bullish structure, invalidation below $2.50.
SUI is approaching a key price zone, with fresh momentum building above key support zones. Analyst CryptoBullet confirmed that Wave 2, which lasted longer than expected, has likely ended near the $2.60 level.
He attributed the extended correction to geopolitical tensions in the Middle East. Now, with SUI trading near $3.94, he projects a 98% probability of a new all-time high forming this year.


CryptoBullet identified this next leg as Wave 3 of the Elliott Wave structure, a phase known for accelerated gains. Before the geopolitical shift, he had noted a strong impulse pattern from April’s low, describing SUI as one of the most structurally bullish altcoins at the time.
Wave Count, Fibonacci Targets, and Structural Supports
The Elliott Wave breakdown shows Wave (1) began in April and topped out near $5.74 in May. Wave (2) followed, forming a classic A-B-C correction and retracing down to the $2.58–$2.60 range.
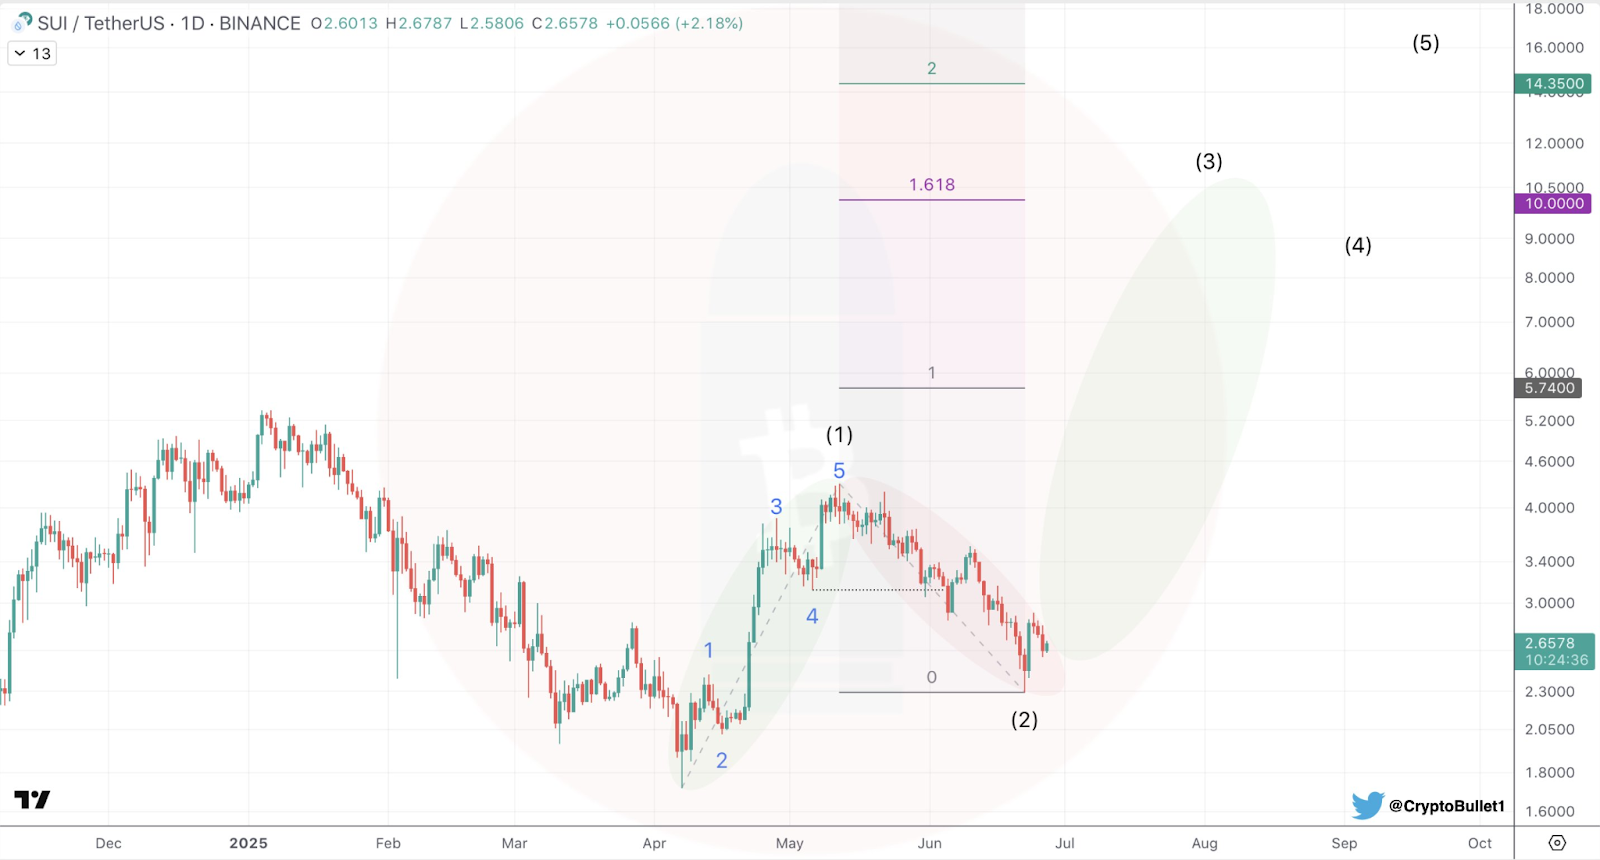
With current price action holding above this level, the start of Wave (3) appears likely. Fibonacci extensions project a retest of $5.74 at the 1.0 level, while the 1.618 extension sets a mid-range target of $10.50.
A 2.0 extension points toward $14.35, with a final push possibly reaching $18.00 if momentum extends through Wave (5). However, a drop below $2.50 would risk invalidating the bullish setup. For confirmation, a breakout above $3.40 is key to confirming the Wave (3) progression.
Volume Patterns and Market Trend Confirm Breakout Behavior
SUI’s price has advanced from a consolidation zone near $2.80–$3.00 to almost $4.00. The breakout above $3.64, the 20-day SMA, shows trend strength, with the moving average now acting as dynamic support.
Bollinger Bands have expanded since July 10, and the upper band now is at $4.1120. Persistent buying pressure has pushed SUI near that level.
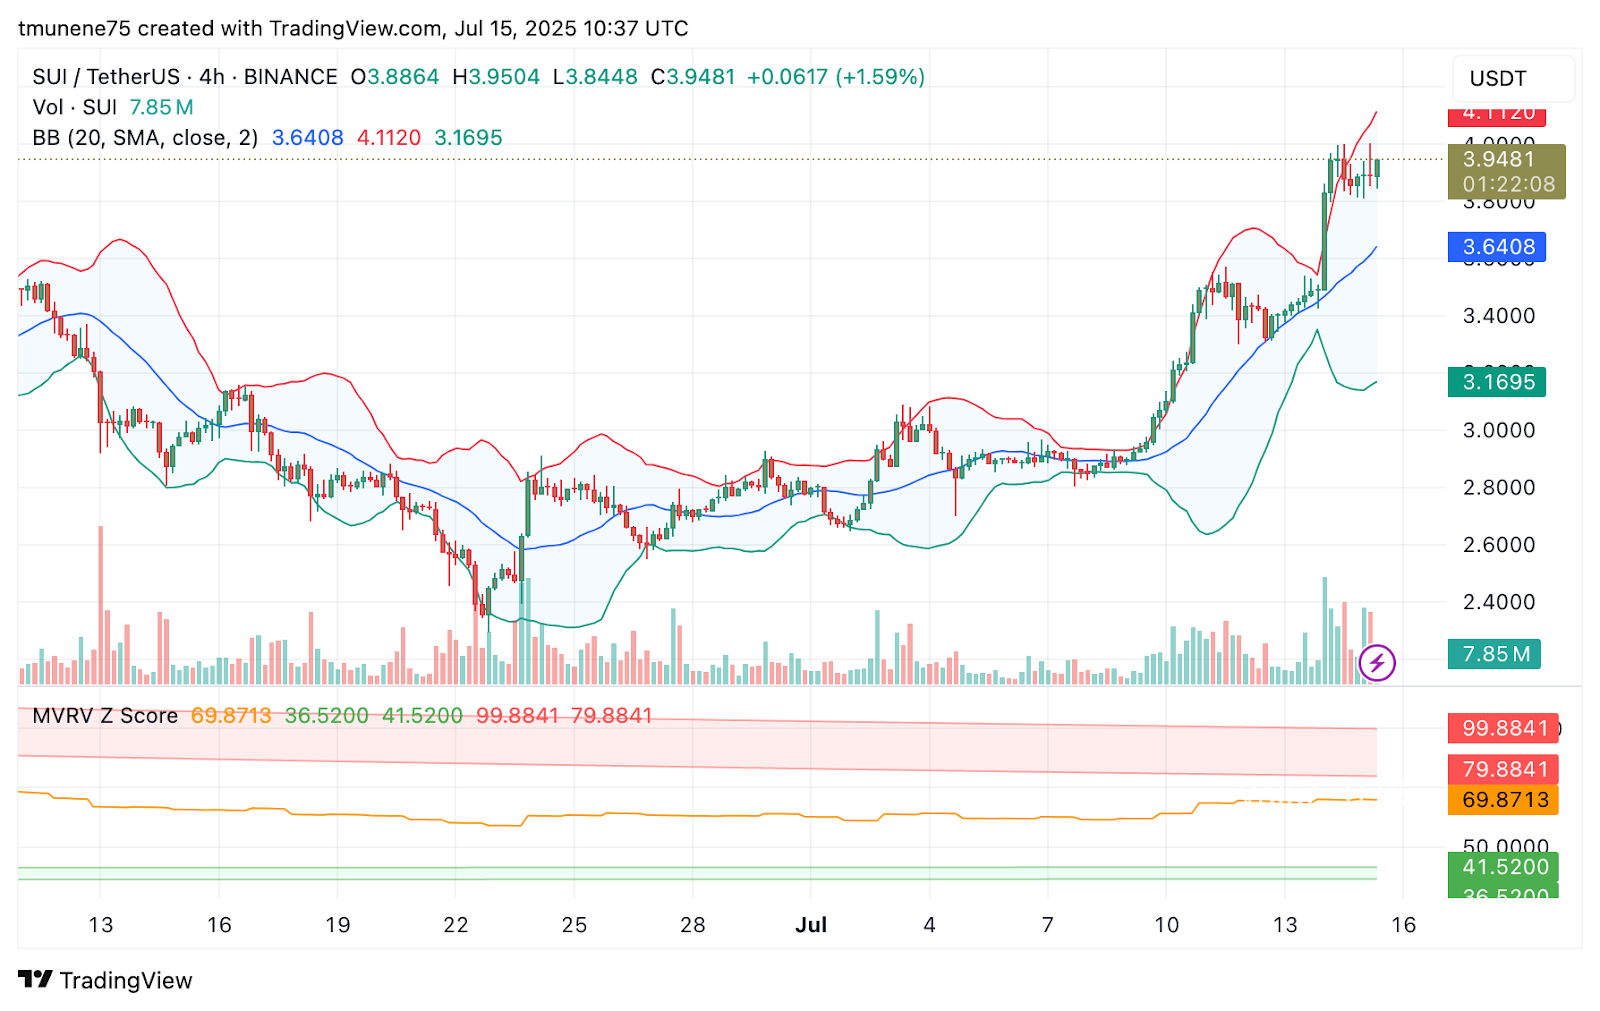
Volume surged past 7.85 million SUI during the $3.60 breakout but has slightly faded in recent sessions. The MVRV Z-Score currently is at 69.87, staying below the red level of 79.88, indicating prices are not yet extremely overvalued.
Resistance Triggers and Analyst Projections
Immediate resistance is at $4.11. A clean breakout could send SUI to $4.50 and $5.00 in the short term. Crypto Patel pointed out a symmetrical triangle forming and forecast a retest of $3.50, followed by $6.00 or even $10.00.
SUI maintains $906 million in daily volume, with a total market cap of $11.9 billion. Analyst Ali had previously stated that a clean move above $3.60 could unlock a 100% rally. If current support zones hold and buying strength returns, Wave 3 could stretch toward the projected Fibonacci targets.


