
- SHIB’s 24 hour burn rate surged by 556.93%, removing 15.39M tokens, with total burns now reaching 410.42T, reducing supply pressure.
- Whale wallets deposited 2.119T SHIB into Coinbase, netting $1.63M profit, suggesting possible profit taking or strategic repositioning.
- SHIB’s RSI at 39.12 suggests bearish-neutral momentum; a break above $0.00001600 could push prices toward $0.00001726 resistance.
Shiba Inu (SHIB) has had sharp price swings, with recent performance showing a downward trend. The broader macroeconomic conditions have contributed to this decline, leading to increased investor sell offs.
Some holders may have exited positions following the introduction of the Official Trump token or due to the ecosystem’s slow development. However, despite the decline, community sentiment remains positive.


Burn Rate Surge and Whale Movements
Recent on chain data shows key SHIB market activity. According to Shiba Inu’s official X page, SHIB’s 24 hour burn rate surged by 556.93%, with 15,399,400 SHIB tokens removed from circulation. The total SHIB burned now is at 410.42 trillion.
Further data from Onchain Lens shows substantial SHIB flows. Four wallets, likely controlled by a single entity, collectively deposited 2.119 trillion SHIB into Coinbase. The transaction, valued at $32.55 million, generated a $1.63 million profit.
These wallets accumulated SHIB between September 2021 and July 2024, acquiring the holdings for $30.91 million. These transactions indicate possible profit taking or strategic repositioning in the market.
Support and Resistance Levels
SHIB’s price movement is in a consolidation phase. At press time, SHIB was trading at $0.00001546, a 0.32% increase.
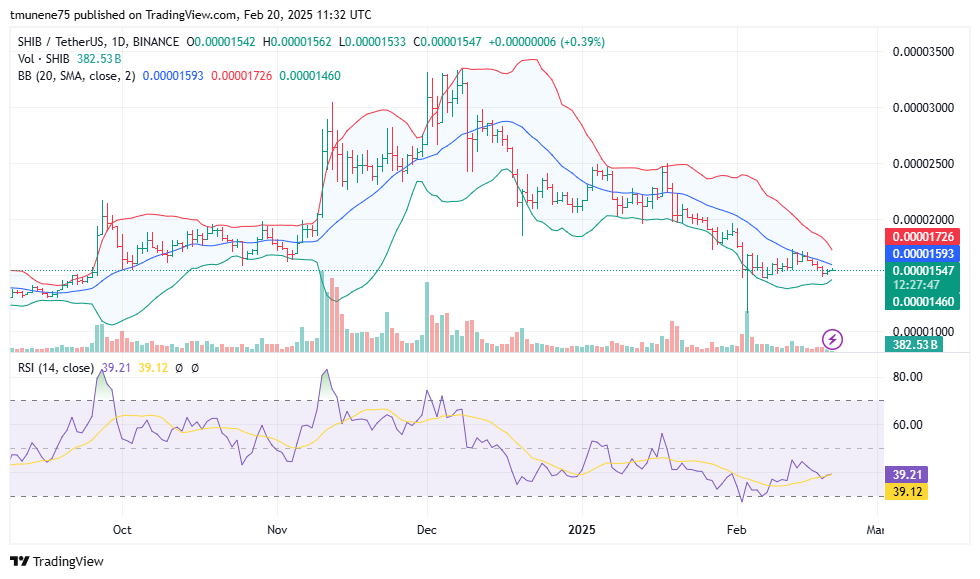
The daily price range is from $0.00001533 to $0.00001562, with trading volume reaching 382.72 billion SHIB, indicating moderate market activity. Bollinger Bands show SHIB price is near the lower band at $0.00001460, a key support level.
The middle band at $0.00001593 acts as a short term resistance. The upper band at $0.00001726 is a higher resistance level. The narrow band formation suggests low volatility, with potential consolidation before a breakout.
The RSI is at 39.12, indicating bearish-neutral momentum. A move above 50 could indicate shifting sentiment, while prolonged low RSI may lead to further consolidation. If SHIB breaks past $0.00001600, the next resistance at $0.00001726 may come into play.
Potential Market Movements and Future Trends
SHIB’s next price move depends on breaking key resistance levels. A move above $0.00001600 could lead to a push toward $0.00001726, strengthening bullish momentum. However, failure to maintain upward pressure may lead to a retest of $0.00001460.
Monitoring key indicators is essential to gauge potential trend reversals. Whale movements and token burns may also be important in shaping SHIB’s market movements in the coming days.


