
- PEPE shows early signs of recovery after months of consolidation and correction.
- Key resistance at $0.00001 could decide the next breakout or price rejection.
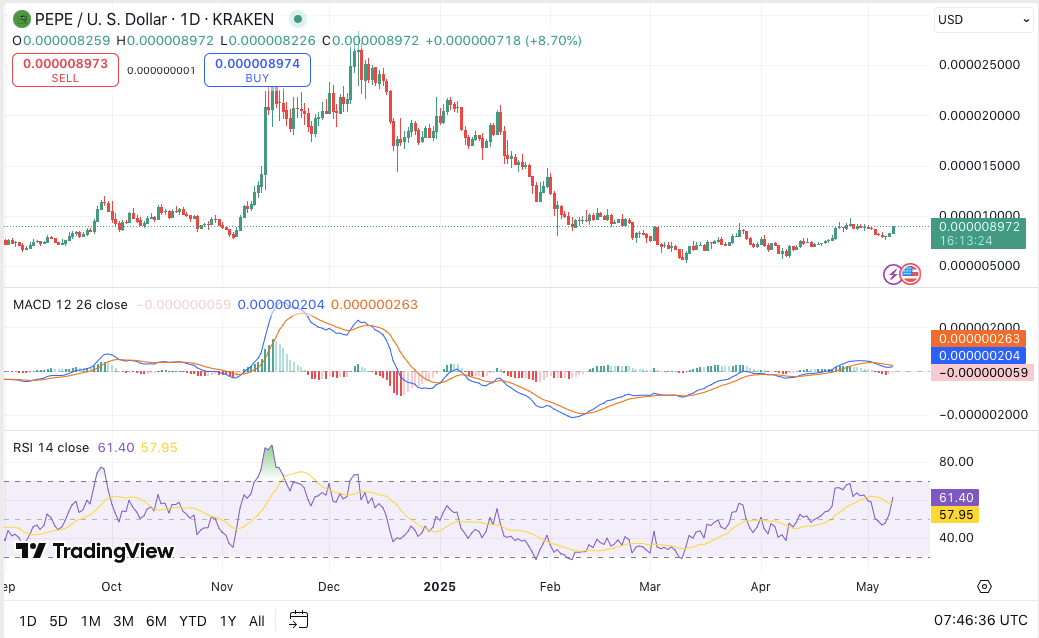
- RSI at 59.82 suggests bullish momentum without signs of overbought conditions.
Pepe (PEPE) has shown impressive price action ahead of May 9, sparking optimism among traders and investors. The token as of press time is valued at $0.059195, with a robust 24-hour trading volume of $732,407,233. This reflects an 8.57% increase over the last 24 hours, signaling renewed bullish momentum.
However, despite this short-term surge, PEPE still holds a minor decline of -0.58% over the past week. With a circulating supply of 420 trillion PEPE, the token’s market capitalization has reached an impressive $3.72 billion. Investors are closely watching as Pepe’s price trend suggests a potential recovery phase following months of correction.


Recent Price Rebound and Short-Term Trend Highlights
Besides the impressive 24-hour performance, PEPE has been forming a series of higher lows since April. This pattern suggests a short-term uptrend emerging on the daily chart. Notably, the token rebounded sharply from a local bottom, lifting its price approximately 6.95% to around $0.000008828 as of the latest daily candle.
Significantly, Pepe had previously enjoyed a rally during late October to November 2024 before entering a prolonged downtrend. PEPE’s downturn lasted until March 2025, after which the token entered a consolidation phase. Hence, the current price behavior hints at early signs of recovery, as the token begins to regain lost ground.
Key Support and Resistance Levels to Watch
Additionally, the technical landscape reveals vital support and resistance zones that traders should monitor. The $0.000006 level acts as a firm support, repeatedly holding up the price during March and April 2025. Moreover, a minor support level around $0.0000072 has helped stabilize the price during recent upward moves.
On the resistance side, PEPE faces its first challenge at $0.00001, a psychological barrier and a former mid-April ceiling. If bulls manage to push past this level, the next hurdle lies at $0.000012, where the price faced rejection in early April. Furthermore, the major resistance zone stands at $0.000015, a historical supply area from late 2024 that could limit further gains.
Technical Indicators Reflect Mixed Sentiment
However, the technical indicators show mixed signals. The MACD line sits slightly below the signal line, indicating weakening momentum, although the histogram remains near zero. Consequently, this suggests indecision among market participants.
Moreover, the Relative Strength Index (RSI) sits at 59.82, indicating bullish momentum without entering overbought territory. Hence, PEPE maintains room for further upside before overheating.


