
- HYPE forms a golden cross, trading above 50- and 200-day MAs, indicating sustained bullish momentum backed by rising volume.
- RSI at 72.04 suggests overbought levels, hinting at potential near-term consolidation despite strong MACD and buying pressure.
- Breakout above $42.50 may target $44–$45, while a pullback to $38–$39 could test support near the 50-day moving average.
Hyperliquid (HYPE) has extended its upward momentum into June, with its price at $42.05 on June 11, 2025 at the time of writing. The token is up by 8.37% in 24 hours, 15.30% in the past week, and 70.52% over the past month.
The market cap currently is at $14.04 billion, while the unlocked market cap is $12.94 billion. Trading volume also saw a sharp rise, up by 42.26% to $525 million. According to Arthur Hayes, “HYPE is melting the faces of shorts.” This indicates the aggressive sentiment behind the rally as the asset pushes against resistance levels.


Momentum Supported by Volume and Technical Structure
HYPE’s price outlook shows strong bullish behavior. Price action has consistently formed higher highs and higher lows, pointing to an established uptrend. The latest candles have large bodies, showing increased buying pressure.
Volume reached approximately 526.67 million HYPE, confirming activity behind the recent price move. Additionally, technical indicators back this bullish phase. The 50-day moving average is at $36.38, while the 200-day moving average is at $31.53.
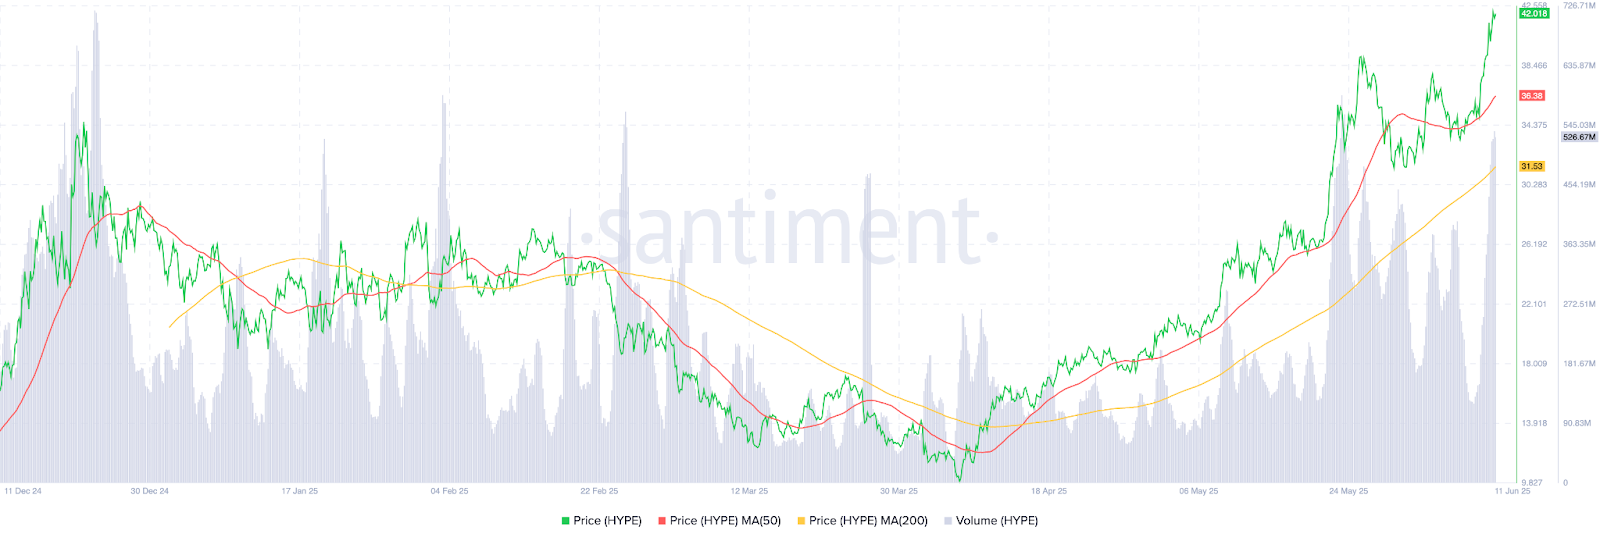
HYPE price dynamics chart, Source: Santiment
HYPE is trading above both levels. The 50-day MA recently crossed above the 200-day MA, forming a golden cross. This move, combined with surging volume, often shows long-term strength. However, such sharp deviations from averages sometimes lead to short-term consolidation.
Overbought Levels Suggest Potential Short-Term Pullback
The RSI is at 72.04, placing it in the overbought levels. The signal line follows closely at 63.19. These values hint that HYPE may be extended in the short term. Meanwhile, the MACD line is at 3.174, above the signal line at 2.850.
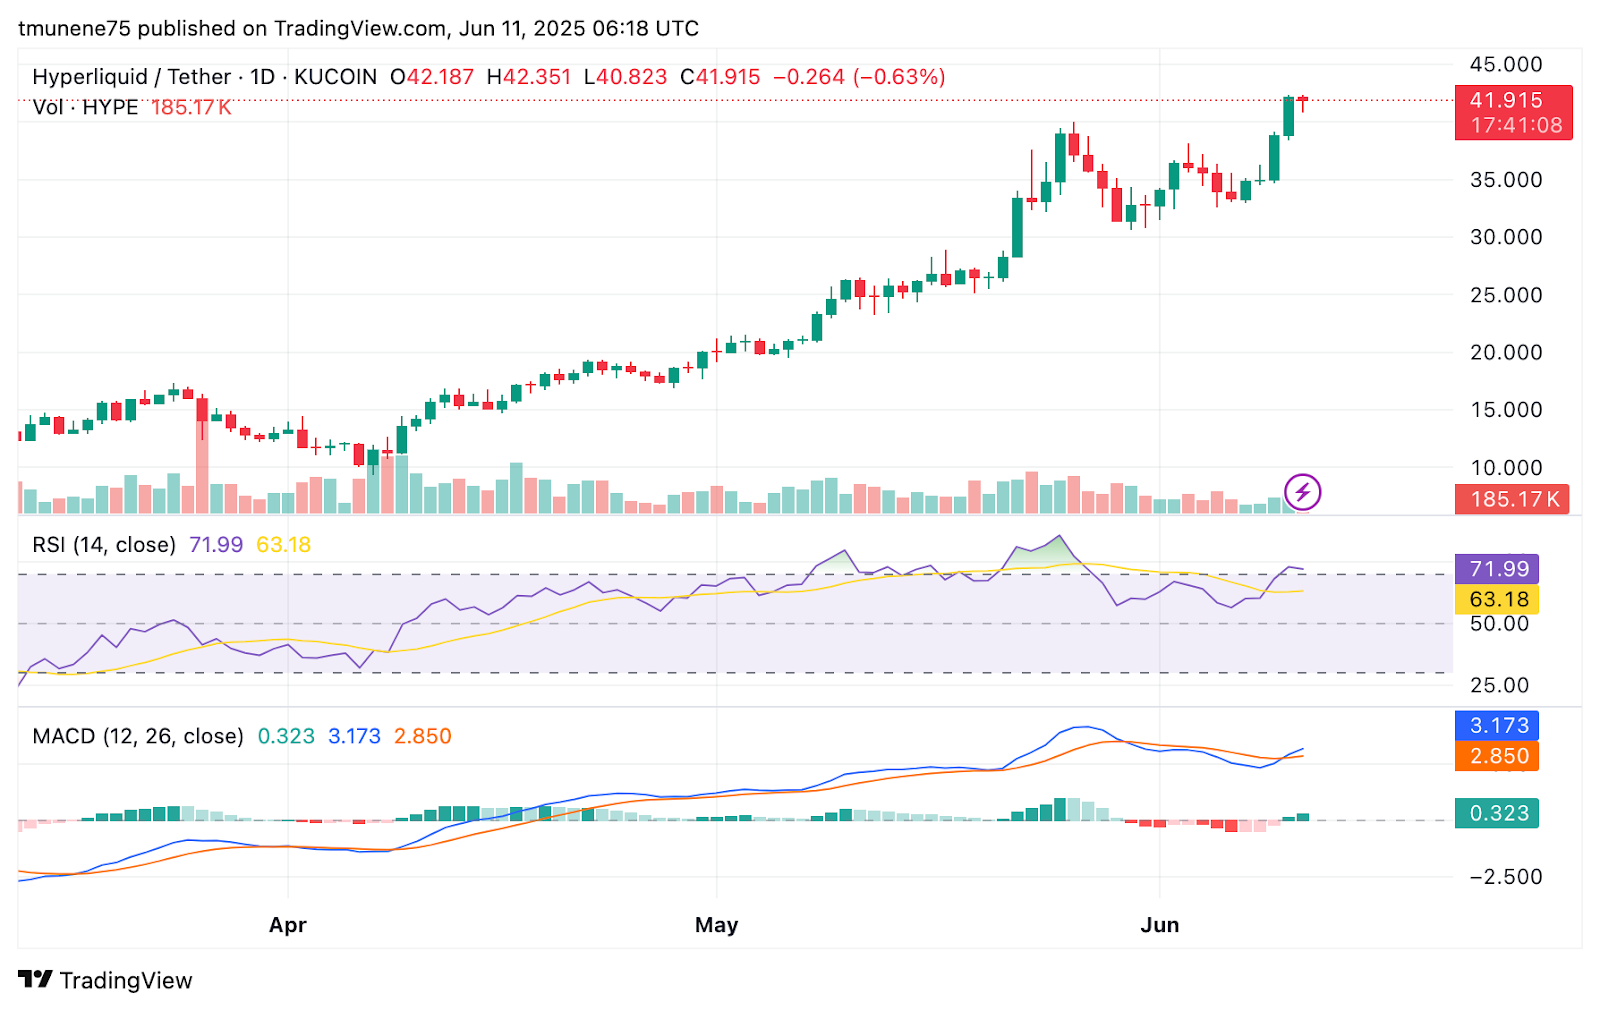
HYPE/USDT 1-day price chart, Source: TradingView
The histogram is at 0.324, showing continued upward momentum. A recent crossover between MACD and signal line confirms buyers remain in control, but current conditions may soon shift.
As HYPE trades around the $42.35 resistance level, the price could go either direction. Support is around $36.00 and $31.50, aligning with major moving averages. Watching these zones for near-term movement is essential, especially given current volumes.
Key Price Levels and Market Behavior
A breakout above $42.50 may lead HYPE to test $44.00 and possibly $45.00 if buying strength holds. On the downside, a retracement toward $38.00 to $39.00 is possible. This would place the price closer to the 50-day moving average and earlier consolidation zones. Whether momentum continues or pauses will depend on volume behavior near resistance.
Hyperliquid maintains strong technical support with institutional-level volume. Despite overbought RSI levels, MACD strength supports continued gains. Momentum is intact, but the coming session will clarify whether a breakout or pullback comes next.
Disclaimer: The content shared by The Daily Crypto Post is intended for informational and educational purposes only and does not constitute financial or investment advice. Readers are encouraged to do their own research or consult with a licensed professional before making any financial decisions. The Daily Crypto Post will not be accountable for any financial losses.


