- HBAR surges 27.4%, approaching key resistance levels amid rising market demand.
- Bullish indicators signal momentum as RSI stays above 50 and MACD turns positive.
- Derivatives data shows rising open interest, hinting at increased market volatility.
Hedera (HBAR) has experienced a sharp increase, surging 27.4% in the past 24 hours. This significant price movement has attracted strong investor interest, pushing HBAR toward key technical levels. The cryptocurrency’s trading volume has also seen a remarkable jump, signaling heightened market activity.
With rising demand, traders are closely monitoring support and resistance levels to determine the next price direction. The combination of bullish technical indicators and growing investor participation suggests further upside potential if certain price thresholds are breached.


Key Support and Resistance Levels
HBAR has established strong support levels that could prevent major price declines. The first significant support lies at $0.1844, the lowest point recorded in the last 24 hours. This level serves as a crucial price floor where buying pressure could emerge.
The next support level is $0.20, a psychological threshold that often attracts buyers during pullbacks. Additionally, $0.21 a former resistance level could now act as support if prices consolidate.
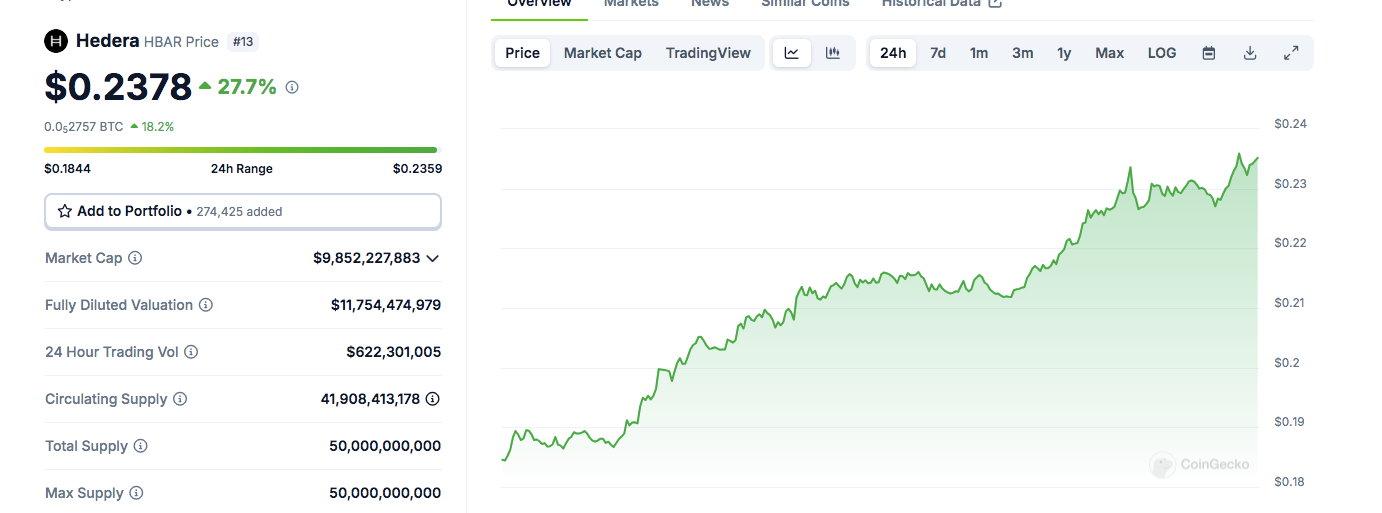
On the upside, HBAR faces resistance at $0.2359, the highest price reached in the last 24 hours. If the cryptocurrency surpasses this level, the next barrier is at $0.24, a round-number resistance that could trigger selling pressure. A breakout beyond $0.25 could further strengthen the bullish momentum, potentially driving prices to higher levels.
Technical Indicators Suggest Growing Bullish Momentum
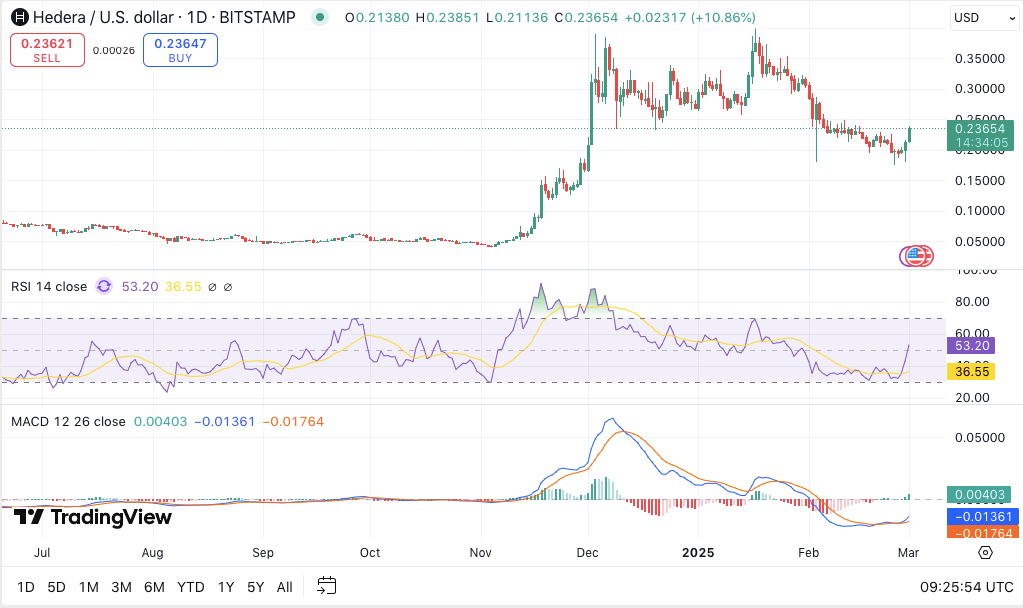
Several technical indicators highlight HBAR’s strengthening bullish outlook. The Relative Strength Index (RSI) currently stands at 53.48, indicating that the asset remains in a neutral zone but is gradually gaining upward momentum. Since the RSI is above 50, it suggests increased buying interest without entering overbought territory.
Meanwhile, the Moving Average Convergence Divergence (MACD) indicates a potential bullish crossover. The MACD line at 0.00408 is turning positive, while the signal line remains at -0.01763. This shift suggests that bullish momentum is building, increasing the likelihood of further price gains.
Derivatives Data Confirms Rising Investor Interest
HBAR’s derivatives market has seen a significant surge in trading activity. Trading volume has jumped 65.26% to $608.87 million, reflecting strong market engagement.
Moreover, open interest has increased 35.38% to $193.96 million, signaling growing investor participation. This trend suggests that traders anticipate further price movement, increasing the potential for volatility in the coming days.


