
- ETH rejected at $2,572 resistance as geopolitical fears fuel $160M in futures liquidations and short-term sell pressure.
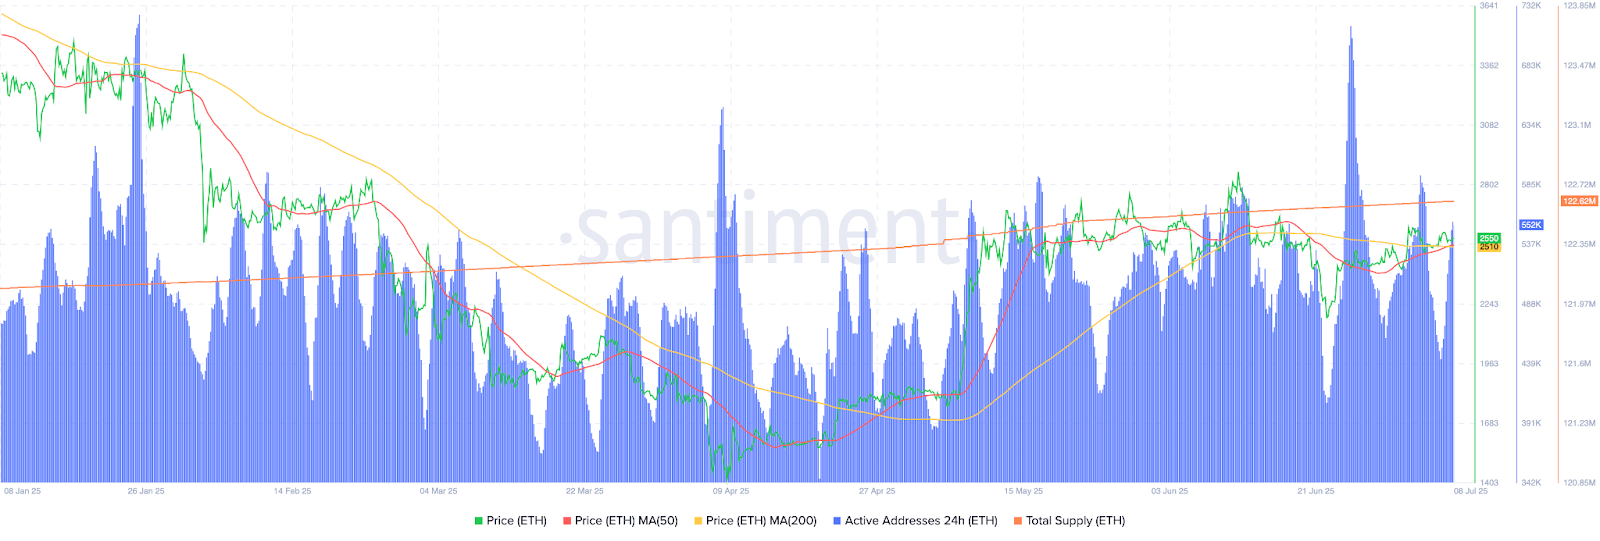
- Active addresses hit 552K, indicating growing network use, but low volume limits bullish breakout potential.
- A move above $2,572 could send ETH to $2,650, while failure may lead to a pullback toward $2,470–$2,490.
On July 8, at the time of publication, Ethereum (ETH) was trading at $2,550.23, recording a 1.09% daily decline. Despite the short-term dip, the asset remained up by 3.76% over the past week and 1.28% over the past month.
Market cap dropped by 1.13% to $307.86 billion, while 24-hour trading volume rose by 16.21% to $17.43 billion. The fully diluted valuation matched the market cap, and the volume-to-market cap ratio is at 5.66%. The circulating and total supply remained unchanged at 120.71 million ETH.


Renewed Geopolitical Tensions Fuel Marketwide Pullback
The decline in ETH’s price on July 8 coincided with rising geopolitical tensions in the Middle East. This led to broad risk-off sentiment across the crypto sector, with Bitcoin (BTC) also registering a 0.8% drop.
According to market data, Ethereum futures saw liquidations totaling $160 million, confirming increased fear among traders. This followed ETH’s rejection at $2,580 resistance, which aligns closely with the 200-day moving average.
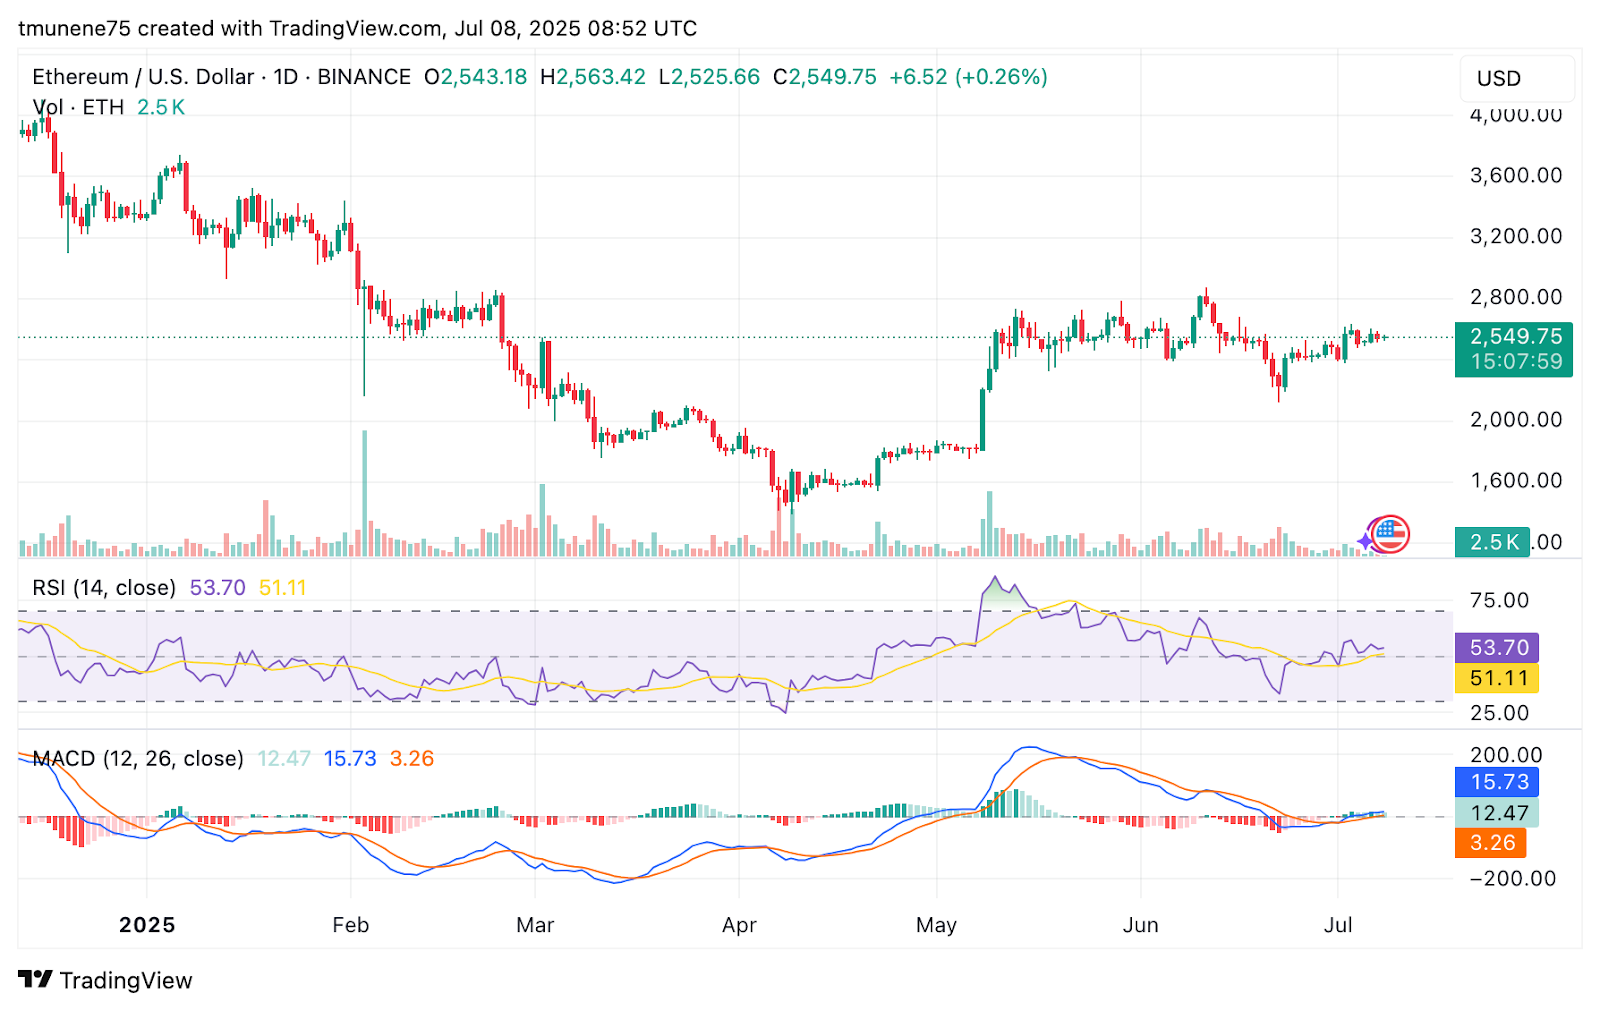
The asset faced profit-taking pressure near that key resistance, contributing to the selloff. The RSI-14 is at 53.29, placing ETH in neutral level.
This level implies neither extreme buying nor selling conditions, allowing for potential movement in either direction. Open interest climbed 9.36% over the week, suggesting a rise in leveraged trades now at risk of unwinding.
Technical Signals Hint at Momentum Shift Near Resistance
Ethereum’s price action has remained range-bound between $2,400 and $2,800 since bottoming near $1,800 in April. Notably, the asset is holding above the 50-day moving average of $2,510.
This upward-sloping indicator points to building short-term momentum. ETH is trading just below its 200-day moving average at $2,572, acting as a crucial barrier. MACD data shows the histogram turning slightly positive, while a bullish crossover appears to be forming.
If this crossover completes with increased volume, it may indicate the return of upward momentum. However, daily volume is modest at 2,500 ETH, indicating limited conviction among traders. A decisive move in either direction will likely require a volume surge.
On-Chain Activity Adds Complexity to Market Outlook
Active addresses reached 552,000, a consistent rise over the past two weeks. This increase suggests growing network activity, often viewed as a precursor to price movement. The total ETH supply is at 122.62 million, reflecting no notable change, implying stable issuance outlook.
Despite these positive on-chain trends, ETH’s inability to close above its 200-day moving average has introduced hesitation. The market remains cautious as external factors like Bitcoin price movement and ETF headlines continue to influence sentiment.
Potential Price Targets for July 09
On the upside, if ETH breaks above $2,572 with strong volume and active addresses remain above 550K, a rise to $2,620–$2,650 is likely. However, if ETH fails at the 200-day resistance and active addresses fall below 530K, a drop to $2,470–$2,490 may follow.
Overall, Ethereum’s July 9 outlook depends on its interaction with the 200-day moving average near $2,572. Market sentiment, on-chain activity, and trading volume will determine whether ETH breaks out or retreats further within its current trading range.
Disclaimer : The content shared by The Daily Crypto Post is intended for informational and educational purposes only and does not constitute financial or investment advice. Readers are encouraged to do their own research or consult with a licensed professional before making any financial decisions. The Daily Crypto Post will not be accountable for any financial losses.


