
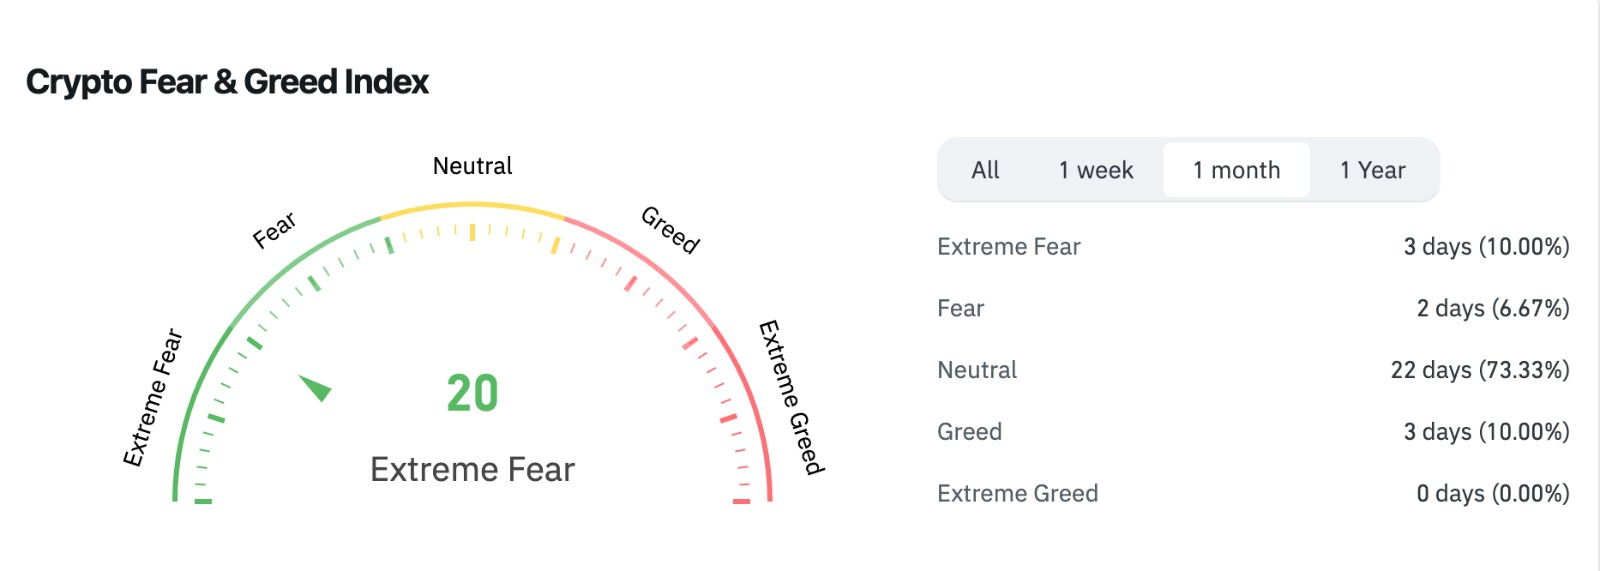
- Extreme fear dominates as the Fear & Greed Index hits 20, suggesting panic selling but potential long-term buying opportunities.
- RSI at 28 shows oversold conditions, while a MACD downtrend persists; a breakout above $2.81T could signal market recovery.
- Market cap at $2.76T shows slight recovery; holding $2.72T support is crucial, with $2.4T as the next major correction level.
The crypto market is experiencing extreme fear, with the Fear & Greed Index dropping to 20. This metric, which measures investor sentiment, suggests increased anxiety and widespread selling pressure.
According to Lucky, a Bitcoin owner since 2015, this level indicates that many investors are overreacting and liquidating assets at discounted prices. Historically, extreme fear can present a buying opportunity for those who take a long term view and seek undervalued assets.


The Fear and Greed Index, a widely followed sentiment indicator, has plummeted to an alarming level of 20, signaling EXTREME FEAR in the markets.
— Lucky (@LLuciano_BTC) February 27, 2025
This extreme fear can lead to overreaction, with investors selling their assets at bargain prices, creating a buying opportunity for… pic.twitter.com/CBCFzIwSFV
Market Sentiment and Investor Behavior
Extreme fear can lead to market-wide panic, causing investors to sell at significantly lower prices. When fear dominates, many traders exit their positions, driving valuations downward. Lucky emphasized that during such periods, quality assets often trade below their intrinsic value.
The current index reading of 20 shows three days of extreme fear within the past month, while neutral sentiment dominated for 22 days. The presence of fear and extreme fear for a combined five days suggests a shift in market sentiment compared to the previous trend.
Despite the bearish sentiment, contrarian investors may view this as an opportunity. Historically, extreme fear precedes potential market rebounds, though a confirmed reversal requires technical confirmation.
The Crypto Total Market Cap is at $2.76 trillion, a slight recovery from its recent low of $2.72T. While the index suggests uncertainty, it does not help assess potential trends but technical indicators do.
Technical Indicators and Market Trends
The market cap had a high of $2.81T and a low of $2.72T, indicating volatility. The RSI is at 28, indicating an oversold condition. RSI levels below 30 typically suggest high selling pressure, but a break above 37-40 is needed to confirm a reversal.
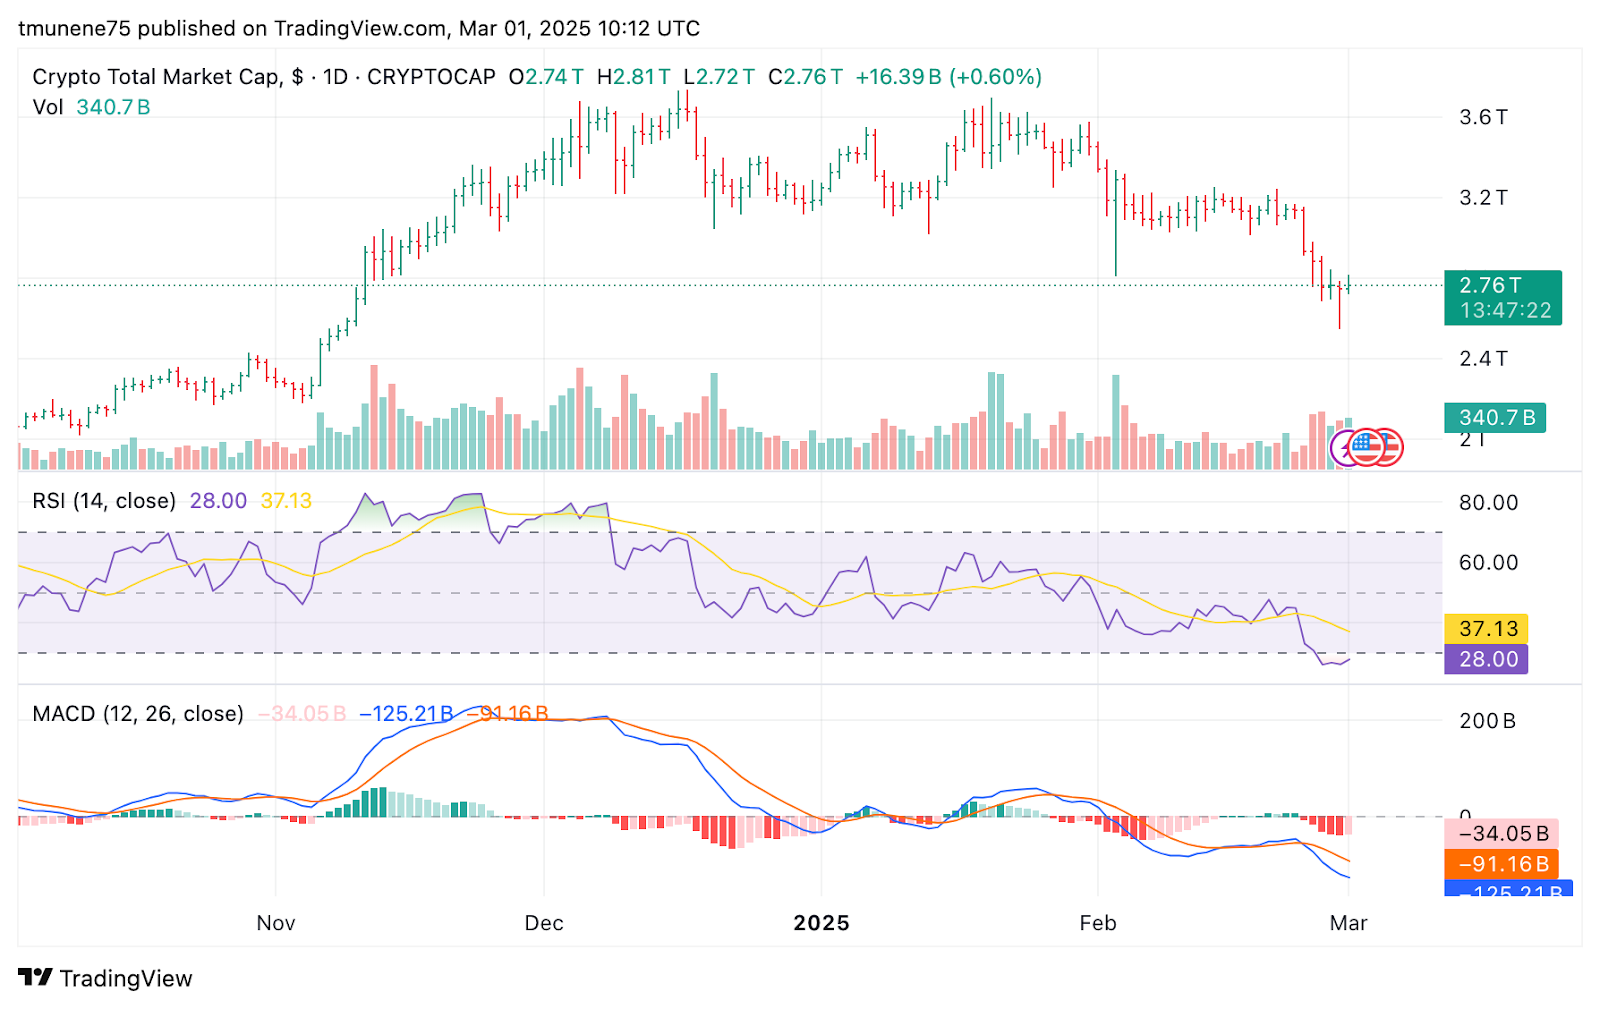
Meanwhile, the MACD indicator is negative, with the MACD line at -125.21B and the signal line at -91.16B. A widening gap between these lines supports the downtrend, but the shrinking histogram at -34.05B suggests selling pressure is easing.
Resistance at $2.81T is a key level to watch. A breakout could push the market toward $3.0T, while failing to hold support at $2.72T may lead to further declines. A drop below $2.4T would suggest a deeper correction, making the next market moves critical.
Future Outlook and Market Considerations
The market is in a cautious phase. Short term trends remain bearish, but early signs of a slowdown in selling pressure could indicate potential recovery. Medium term movement depends on whether the market can reclaim key resistance levels.
A push above $2.81T would suggest recovery, while further declines may intensify bearish momentum. Long term direction will likely depend on major catalysts such as regulatory developments, institutional interest, and Bitcoin’s performance.


