
- BTC must hold above $106K to avoid deeper losses toward $103K–$98K as Bollinger Bands signal tightening volatility.
- Bitcoin’s rally from April remains intact above 50 and 200-day MAs despite short-term dips and lower trading volume.
- A breakout above $112K could lead to further gains toward $114K, reaffirming bullish momentum in the medium term.
Bitcoin has continued its retracement from recent highs as short-term volatility challenged bullish momentum. On May 12, at press time, BTC was trading at $107,286, a 1.85% dip over 24 hours. Despite the drop, weekly and monthly performances are positive, with gains of 2.51% and 3.60%, respectively.
Market cap is at $2.13 trillion, while trading volume reached $53.35 billion, a modest 1.86% increase. Meanwhile, circulating supply is fixed at 19.87 million BTC, just below the maximum limit of 21 million.


Technical Indicators Point to Consolidation
Candlestick formations indicate renewed selling pressure, with the day’s candle forming a red body. Bitcoin’s price traded between a low of $107,157 and a high of $108,851, while opening at $108,653.
The Bollinger Bands indicate a potential contraction in volatility after a recent uptrend. The upper band is at $111,189, middle at $106,665, and lower at $102,141. Bitcoin is testing the 20-day simple moving average, which aligns with the middle Bollinger Band. If price action holds above this level, bullish strength could persist.
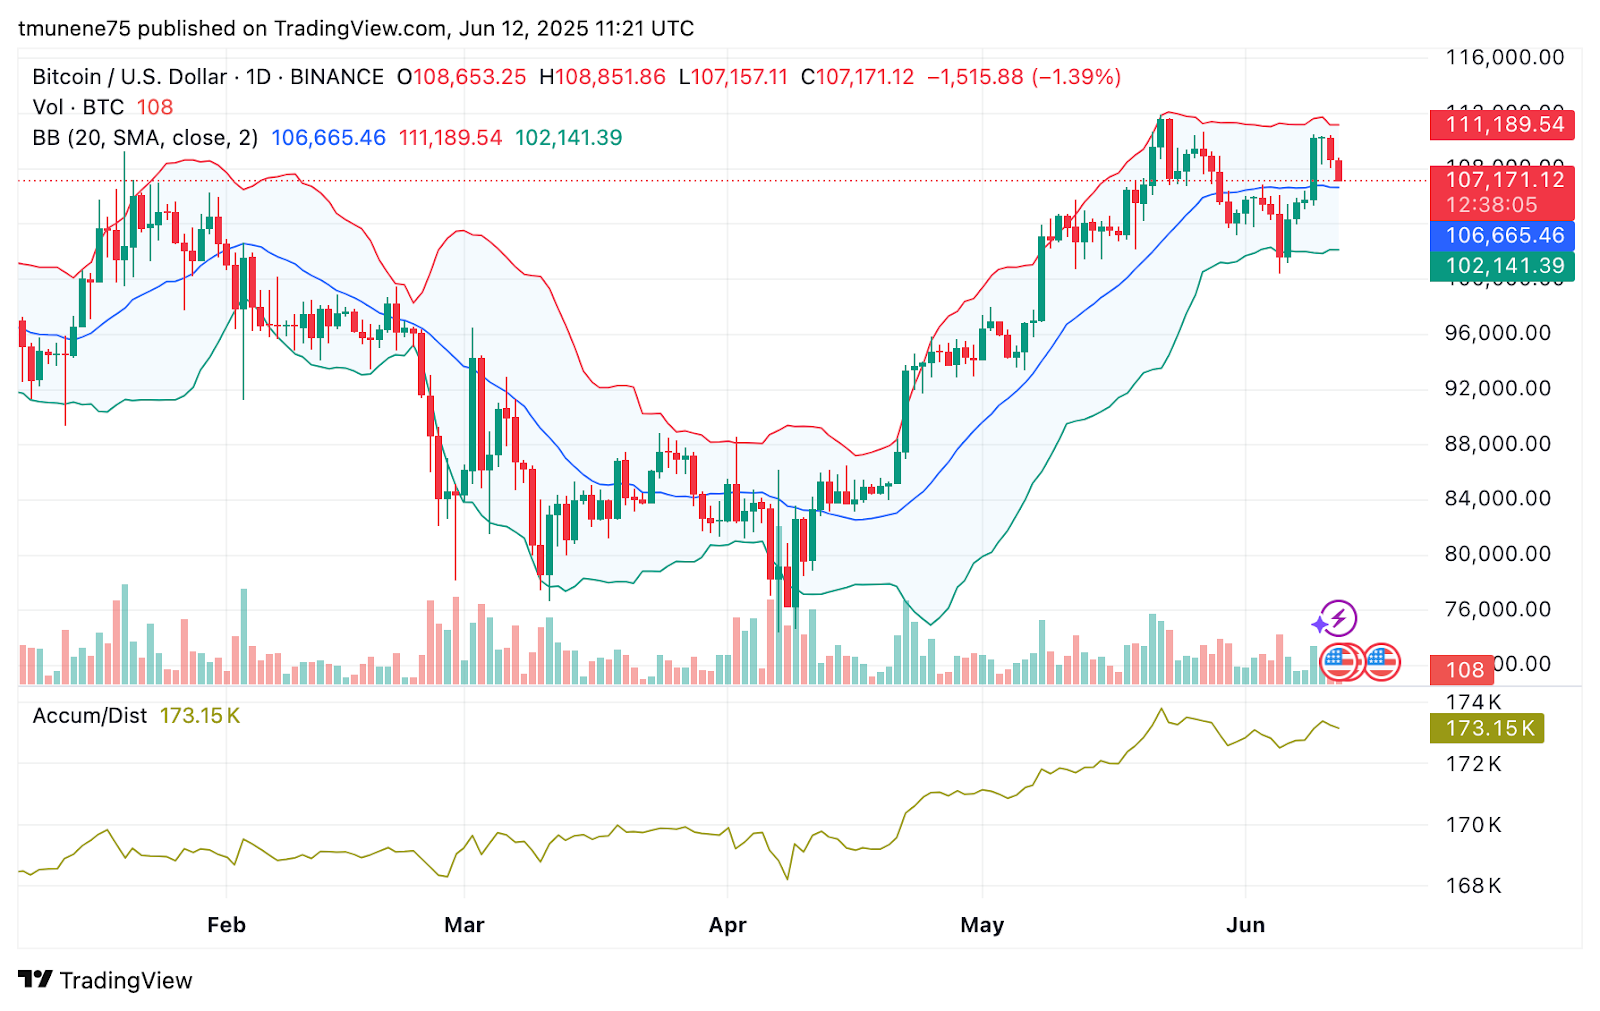
However, a breakdown below $106,665 may expose Bitcoin to deeper losses toward $102,000. Daily volume is at 108 BTC, pointing to limited short-term activity. The Accumulation/Distribution line is steady at 173,150, suggesting minor profit-taking.
Moving Averages and Volume Strength
Since early April, Bitcoin has moved in a clear uptrend after bouncing from below $83,000. Notably, this followed a prior downtrend from December to March, confirmed by a bearish death cross in January.
A bullish reversal began as BTC reclaimed the 200-day moving average and formed a golden cross in late May. Bitcoin’s rally extended past $112,000 before facing a pullback. It now trades above both the 50-day and 200-day MAs, suggesting continued strength.
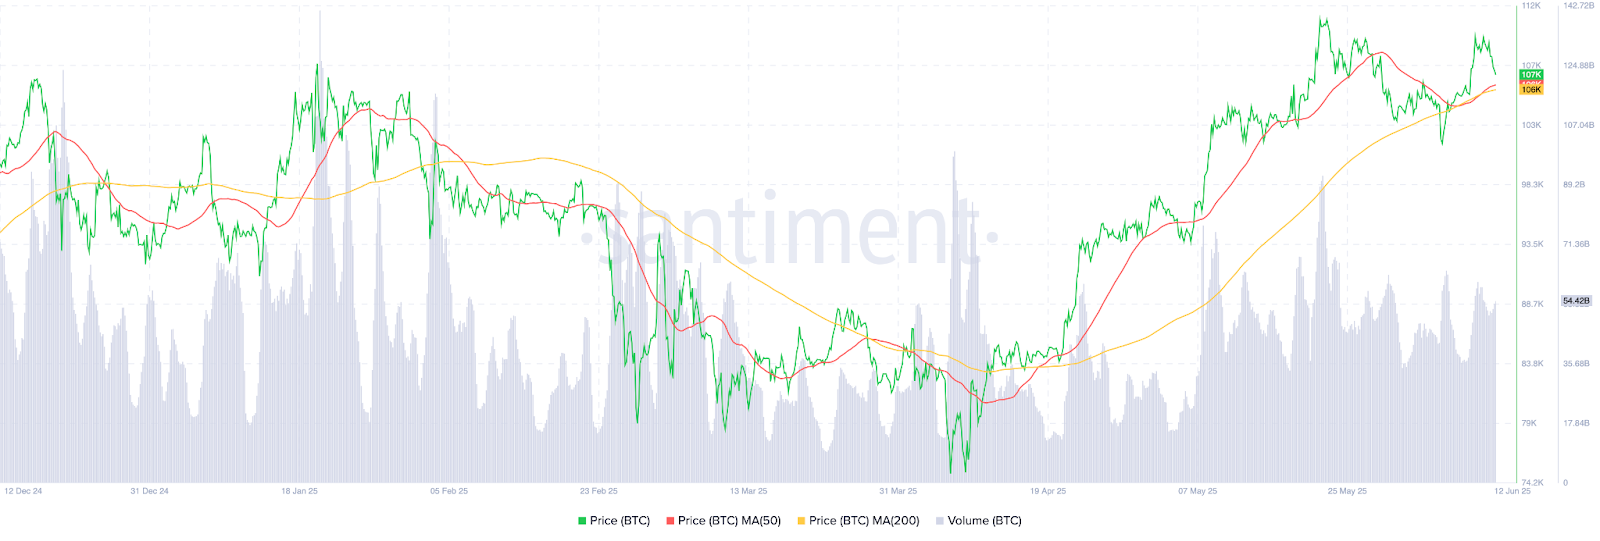
Support is at $103,000, aligned with the 200-day MA, while resistance remains firm near $112,000. Daily trading activity remained steady at $54.42 billion, indicating the confidence in the current uptrend.
Short-Term Scenarios Depend on Key Moving Averages
Bitcoin must maintain levels above the 50-day MA, around $106,000, to sustain upside momentum. If successful, a breakout past $112,000 could push prices toward $114,000. However, failure to hold $106,000 might drive Bitcoin lower to retest $103,000, with further losses extending to $98,000.
Disclaimer : The content shared by The Daily Crypto Post is intended for informational and educational purposes only and does not constitute financial or investment advice. Readers are encouraged to do their own research or consult with a licensed professional before making any financial decisions. The Daily Crypto Post will not be accountable for any financial losses.


