
- XRP trades above the 200 day MA, showing long term bullishness, but short term weakness persists below the 50 day MA.
- On-chain data shows a drop in daily activity, yet long term holder growth suggests sustained investor confidence.
- RSI and MACD point to reduced momentum, with price consolidation likely unless XRP breaks key resistance at $3.30.
XRP continued to show volatility on July 30, trading at $3.13 at press time. The token dropped by 5.39% in the past 24 hours and fell by 9.4% over the past week. However, on a broader timescale, XRP remains up by 43.53% over the past month.
The market cap is at $186.03 billion, a 5.35% decline. Despite short term weakness, trading volume rose by 18.03% in the same 24 hour period, reaching $7.29 billion. This suggests ongoing interest in XRP, even as price pressure builds.


Moving Averages and Market Structure Indicate Mixed Momentum
XRP price is above the 200 day moving average of $2.75 but is below the 50 day mark of $3.28. Notably, the asset had recently peaked above $3.60 before retreating. This technical setup shows a bullish long term outlook, yet reveals short term softness.
The current structure indicates that XRP could stabilize near the $3.08–$3.10 region, with resistance likely around $3.25–$3.30. A move above $3.30 may push the asset back toward the $3.50 zone.
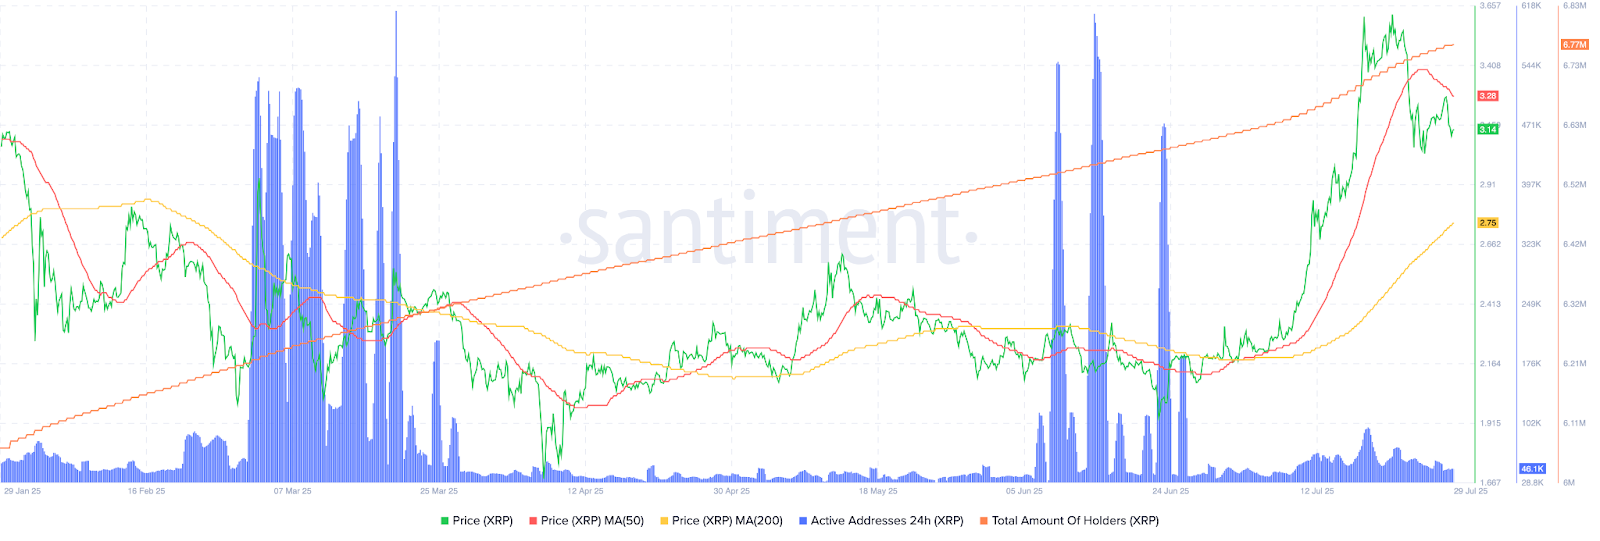
On-chain data supports this transition. Active addresses surged above 600,000 in mid July but have since dropped to roughly 46,100. This sharp decline reflects reduced user interaction.
However, the number of total holders rose steadily, now reaching 6.77 million. This steady rise suggests growing long term activity despite a cooling in daily usage.
Technical Indicators Show Diminishing Momentum in the Short Term
Technical indicators further show current market hesitation. The RSI is at 58.64, down from its recent peak of 72.86. This drop indicates reduced momentum, yet the index is above the neutral 50 mark, showing moderate bullish bias.
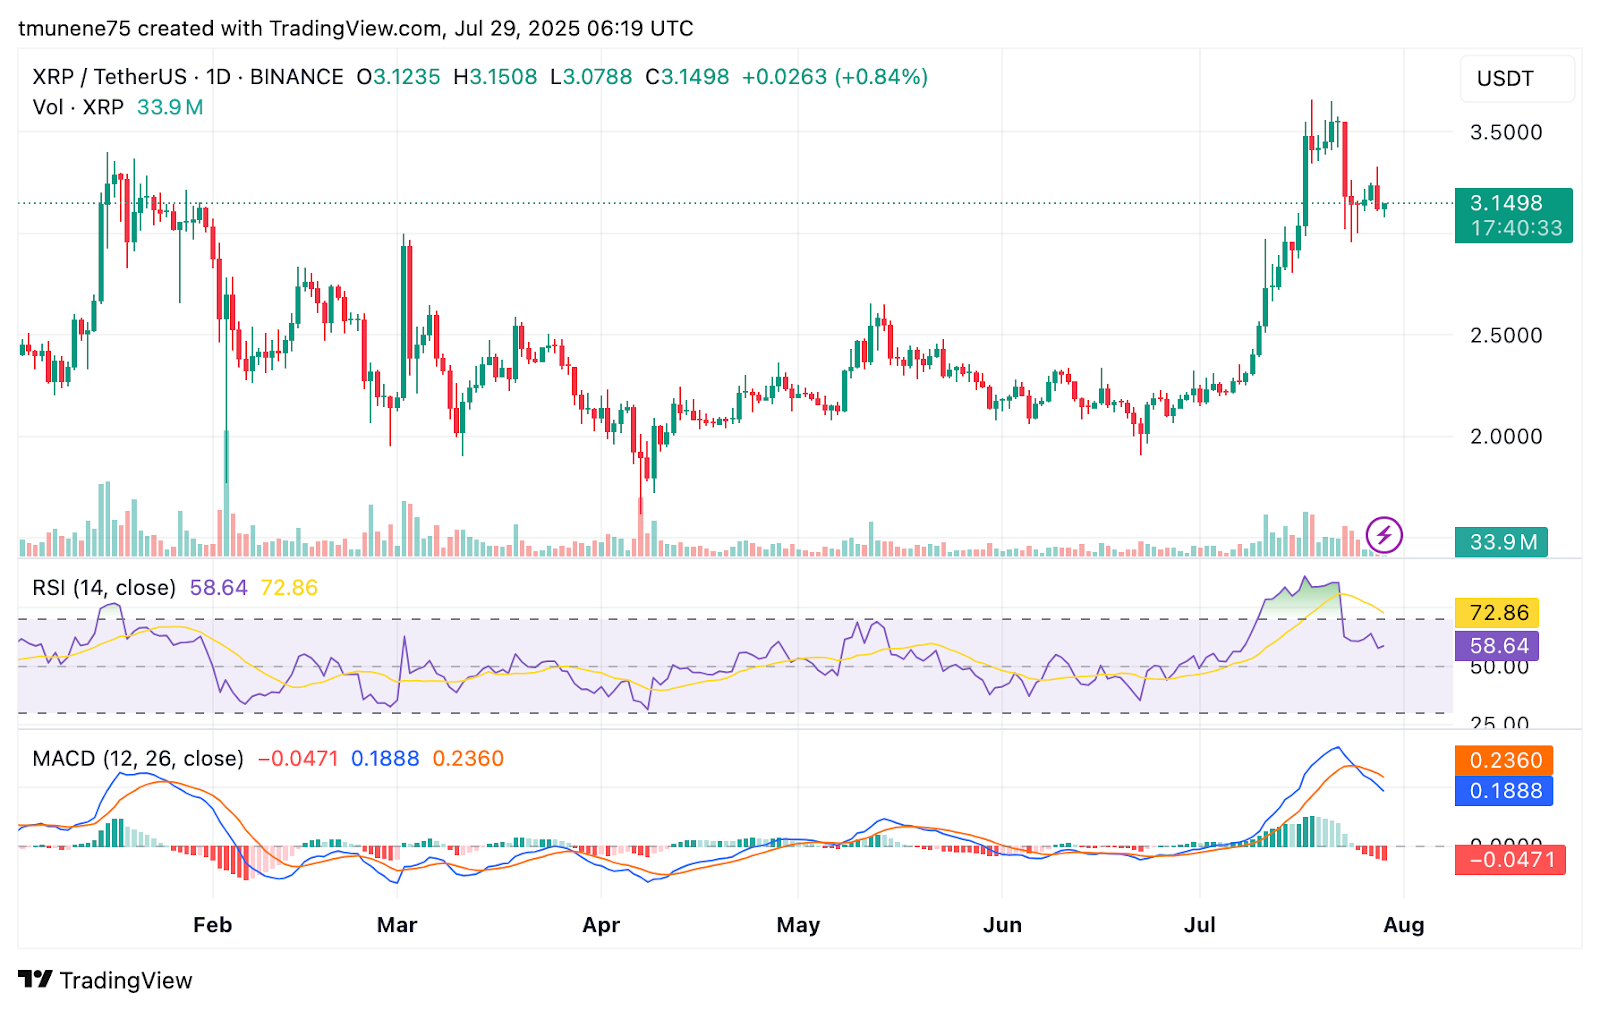
Meanwhile, the MACD shows a bearish crossover. The MACD line is at 0.1888, below the signal line of 0.2360, with a negative histogram of -0.0471. This configuration signals weakened momentum, with price direction depending on upcoming trading activity.
Trading volume also presents a mixed picture. At 33.9 million, it is below levels seen during XRP’s recent rally. This suggests hesitation among market participants.
On-Chain Trends Show XRP’s Underlying Demand
Despite short term pullbacks, XRP’s total supply is near its maximum, with 99.98 billion tokens available and 59.23 billion circulating. This supply structure limits inflationary risk.
Additionally, the Fully Diluted Valuation (FDV) is at $314.04 billion. The 24 hour volume-to-market cap ratio of 3.93% further confirms moderate trading engagement across the board.
If XRP reclaims the 50-day MA, currently at $3.28, it may revisit the $3.35–$3.45 range. However, failure to hold above $3.00 may push it down to test $2.90 or even the 200-day MA near $2.75.
Overall, XRP is trading within a consolidation range. While long-term indicators remain bullish, short-term momentum and volume trends point to caution. The next move will depend on renewed trading interest and RSI stabilization.
Disclaimer : The content shared by The Daily Crypto Post is intended for informational and educational purposes only and does not constitute financial or investment advice. Readers are encouraged to do their own research or consult with a licensed professional before making any financial decisions. The Daily Crypto Post will not be accountable for any financial losses.


