
- Pi Network price weakens as $0.4400 support nears breakdown under bearish trend.
- Daily volume drops over 50%, signaling fading interest and potential sell-off risk.
- MACD and RSI reveal fragile momentum, casting doubt on short-term recovery strength.
Pi Network has recently made headlines with bold claims suggesting its AI technology could rival or even dethrone Ethereum. While these rumors fuel excitement, a closer look at Pi’s current market performance paints a more cautious picture. With its price slipping and technical indicators flashing red, it’s clear the path ahead is anything but certain.
Bearish Momentum Builds as Price Falters
The current price of Pi Network stands at $0.4412, showing a 1.18% decline over the past 24 hours. This downward trajectory has persisted throughout the day, with no strong signs of a reversal. The trend has been defined by a consistent pattern of lower highs and lower lows, indicating continued bearish pressure.


At its intraday high of around $0.4536, the token faced sharp resistance, reversing quickly and failing to hold gains. This level now acts as a key ceiling for any short-term recovery attempts.
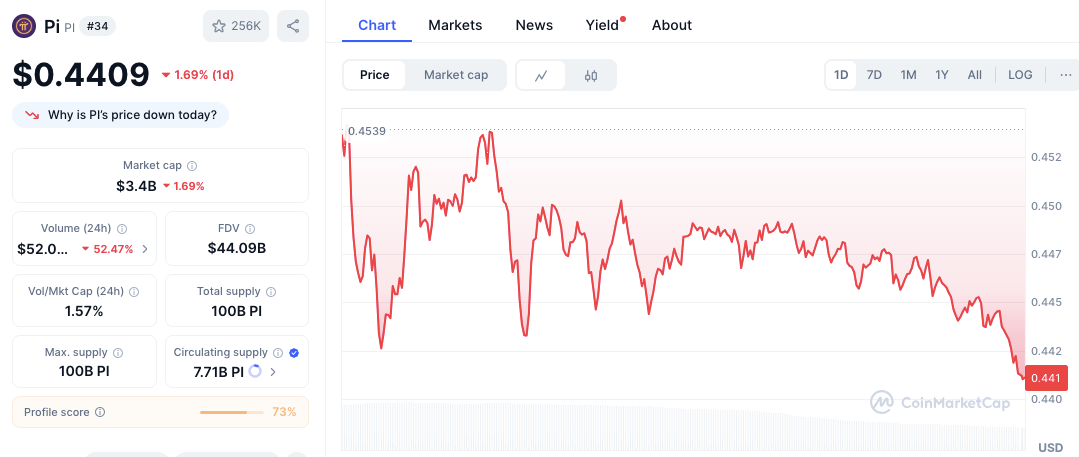
Meanwhile, the $0.4400 mark serves as an immediate support. A break below this level could open the door to further losses, with $0.4300 being the next psychological safety net for traders.
Volume Drops While Sentiment Weakens
One of the most significant red flags is the sharp drop in trading volume, now at $53.3 million down over 50% in a single day. This decline highlights waning buying interest and a lack of bullish momentum. Besides, the market cap has slipped to $3.4 billion, further emphasizing the uncertain sentiment surrounding the token.
Moreover, the fully diluted valuation stands at $44.07 billion, which is disproportionately higher than the circulating supply. This massive gap suggests that a large portion of the token remains locked, potentially introducing selling pressure in the future.
Technical Indicators Signal Fragile Conditions
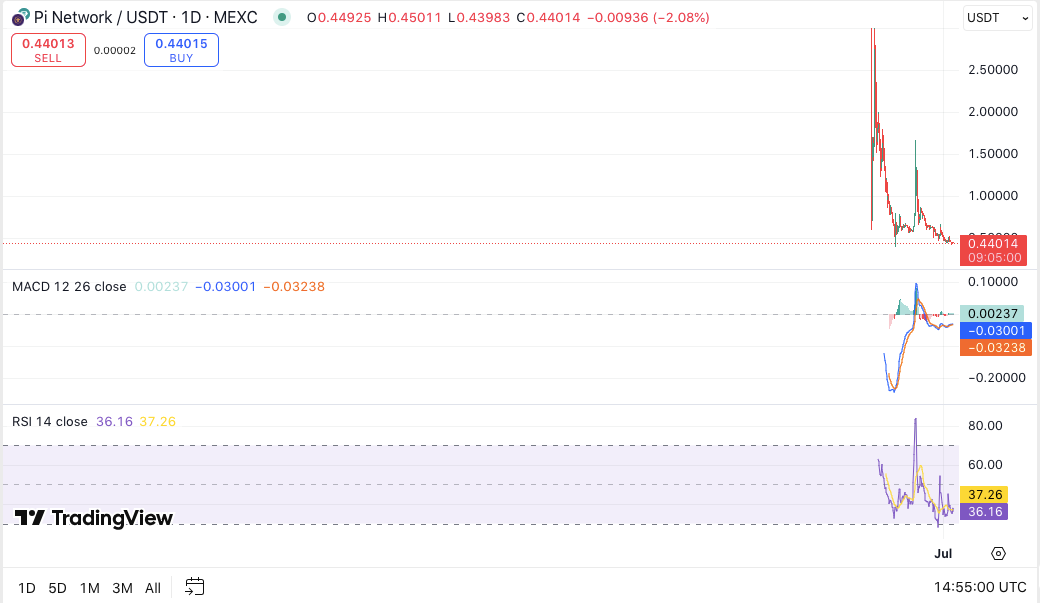
From a technical standpoint, Pi’s MACD is showing signs of a weak bullish shift. The histogram has turned slightly positive, hinting at a minor momentum reversal. However, the MACD line remains below zero, making any bullish thesis premature at best.
Meanwhile, the RSI stands at 36.24, nearing oversold territory. This may suggest a potential rebound, but it also reflects ongoing weakness. If buyers fail to reclaim ground above $0.4470, bearish control could deepen.


