
- SUI remains supported at $2.87 as it consolidates within a long-term rising channel.
- Re-accumulation zone spans $2.20–$4.00, showing consistent buyer interest over multiple months.
- RSI and MACD confirm consolidation, with no strong breakout signal currently in play.
SUI is currently holding near the $2.93 level following a 2.1% price increase over the last 24 hours. This price activity occurs as the token trades within a clearly defined re-accumulation zone, with visible support at $2.87.
Technical positioning reflects a sustained effort to maintain momentum above this demand region. Volume remains active, with $544.73 million recorded in the past session. While the current range remains tight, broader chart structure still supports higher timeframe continuation. SUI’s recent price behavior may indicate preparatory accumulation, given its proximity to key support and lower channel boundaries. In the weekly chart, price has demonstrated strength in a long-term upward channel. Market action has still respected the lower trendline with SUI bouncing off it since early 2024.


Price Range Tightens Near Strong Support Level
SUI’s trading range tightened recently between $2.87 and $2.94. The support level at $2.87 continues to attract buyer interest. Short-term traders are closely watching this level, especially given the pattern of bounces from this zone since late May.
The current structure suggests this level may remain valid unless invalidated by strong sell-side volume. According to analyst CryptoPatel, SUI could mirror Solana’s past growth. From his views, the current range may be the key re-accumulation zone and the next price $2.50 surge could be significant.
The weekly chart indicates a possible retest of the mid-range resistance near $4.00 in the medium term. However, this level must first be cleared for any meaningful advance. Until then, any price movements will likely remain confined within the $2.80–$4.00 range.
This zone also aligns with the broader re-accumulation region marked on the chart, which extends from approximately $2.20 to just under $4.00. Notably, price has remained inside this area for several months, with only brief deviations.
Technical Indicators Reflect Consolidation Across Timeframes
Momentum indicators on the hourly time frame suggest consolidation is underway. The RSI currently reads 61.23, just above the mid-level. This shows slight bullish bias, although it remains well below the overbought threshold of 70.
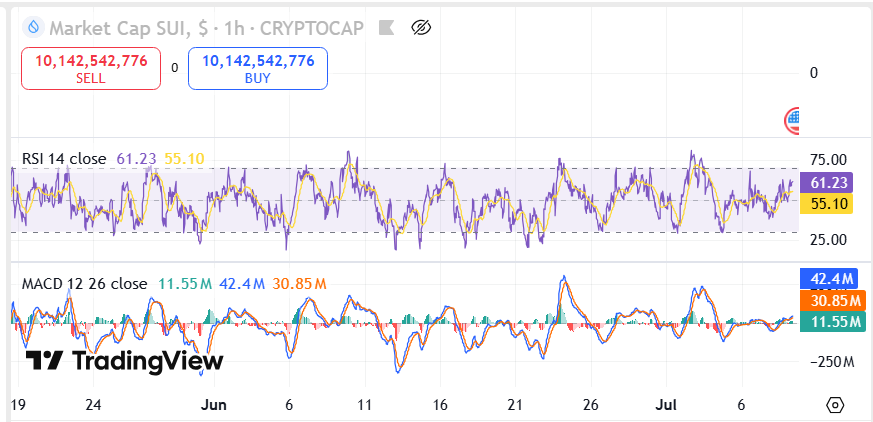
MACD readings also reflect a neutral-to-slightly-positive outlook. The MACD line at 10.86M remains above the signal line of 30.68M. Buy volume sits at 41.54M, outpacing sell volume at 30.68M. However, the narrow spread suggests buyers are not yet dominant.
Considering that these indicators resist shaping a more noticeable trend, the market participants will probably wait until a decisive shift above 2.94 or below 2.87. In the meantime, price should remain in range with increased volatility reflecting both technical form and balance in volume.


