
- XRP faces bearish pressure, testing key support at $2.25 amid a 3.24% daily decline.
- A break above $2.30 may signal bullish momentum, targeting the $2.35–$2.37 zone.
- RSI at 46 and weakening MACD histogram suggest potential trend reversal ahead.
XRP is facing short-term bearish pressure as its price hovers around $2.25, reflecting a 3.24% daily decline. The market sentiment suggests downward momentum, with recent price action indicating struggles to maintain higher levels.
While the price reached a high of $2.37 before reversing, it is now testing crucial support zones. Traders are closely watching key levels that may determine whether XRP experiences a recovery or further downside movement.


Support and Resistance Levels Impacting XRP’s Trend
XRP is currently testing a key support level at $2.25. If selling pressure persists, the price may decline toward the $2.22–$2.23 range, where previous buying interest has been observed. Additionally, $2.20 remains a critical psychological support level that could prevent a deeper drop.
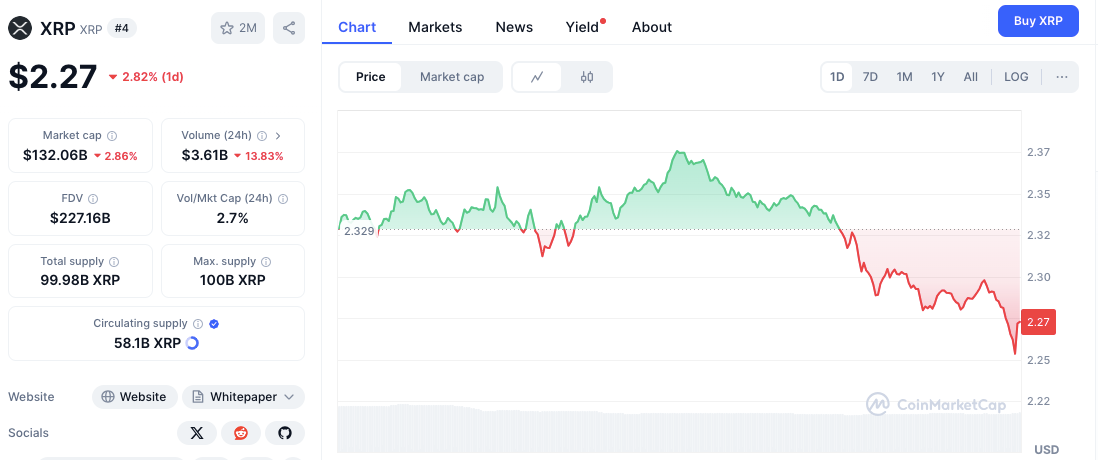
On the upside, XRP must overcome multiple resistance levels to regain bullish momentum. The first barrier lies between $2.30 and $2.32, where the price previously faced rejection. A stronger resistance zone exists between $2.35 and $2.37, marking the level where XRP reversed its recent uptrend. If bulls manage to push the price beyond $2.40, it could trigger a broader recovery, attracting more buyers into the market.
Potential Scenarios for XRP’s Next Move
If XRP finds strong support at $2.25 or slightly lower, a rebound could occur. A break above $2.30 would be the first sign of bullish momentum, allowing an attempt to challenge the $2.35–$2.37 resistance zone.
However, failure to hold $2.25 may expose XRP to further declines. A drop below $2.22 would increase the probability of testing the $2.20 support level, which has historically held firm during downturns.
Technical Indicators Suggest Possible Trend Shift
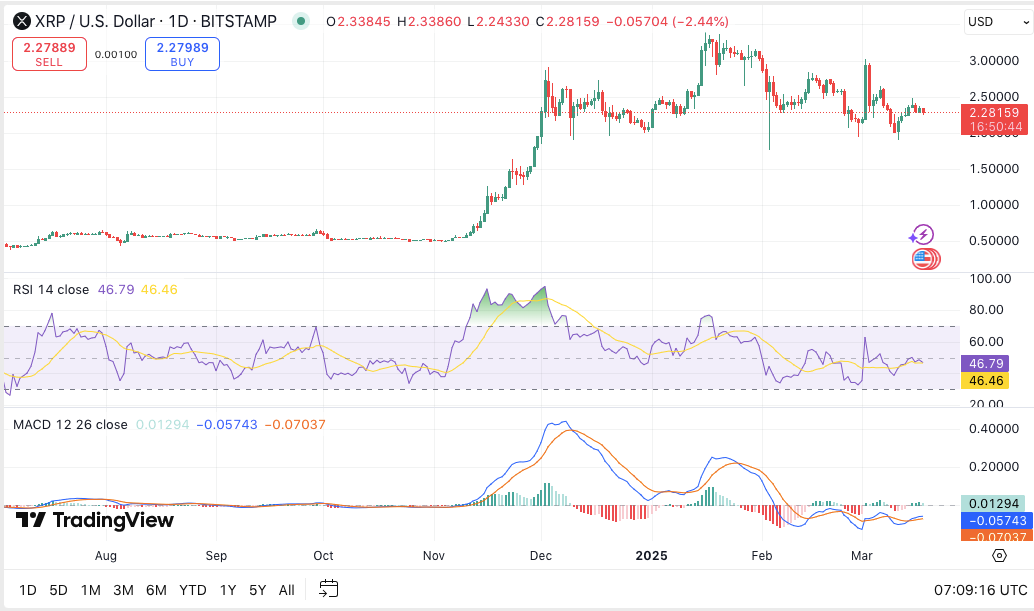
The Relative Strength Index (RSI) is currently around 46, indicating neutral conditions. XRP is neither overbought nor oversold, leaving room for potential movement in either direction. If the RSI rises above 50–55, it would signal increasing bullish momentum, potentially leading to a price recovery.
The Moving Average Convergence Divergence (MACD) indicator currently shows a bearish crossover, with the MACD line sitting below the signal line. However, histogram bars are weakening, suggesting that selling momentum could be fading.


