
- XRP trades below key MAs, with $2.10 support and $2.20 resistance, indicating persistent bearish pressure and weak momentum.
- RSI at 42.67 shows soft buyer strength, while MACD’s mild bullish crossover hints at a possible shift if volume improves.
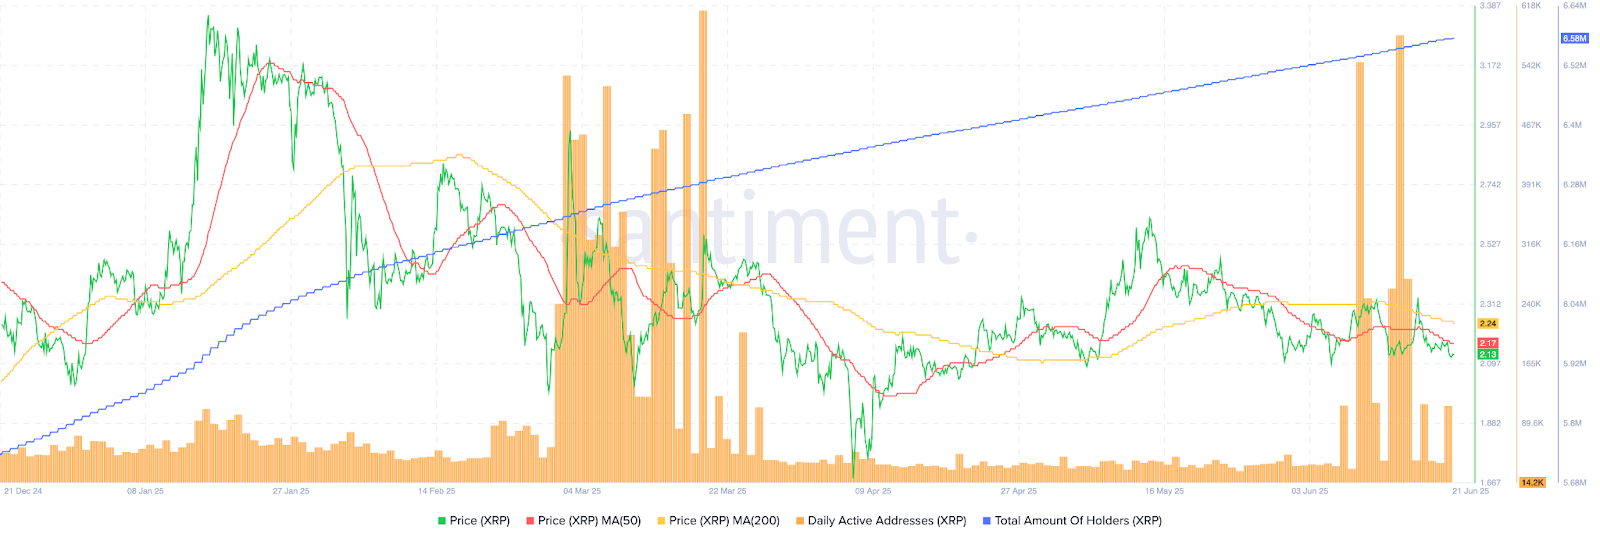
- Despite falling daily active users, XRP holders increased to 6.58M, suggesting long-term confidence amid short-term uncertainty.
XRP is having a period of subdued trading in the short-term, with its price fluctuating between tight support and resistance levels. At press time, XRP was trading at $2.12, a 1% decline in the past 24 hours.
The asset has also dropped by 1.14% over the past week and 11.28% in the past month. Market cap is at $125.53 billion, down by 0.87%, while 24-hour volume surged by 45.24% to $2.47 billion.


XRP’s current fully diluted valuation is at $212.99 billion, with 58.93 billion tokens circulating from a max supply of 100 billion. The token’s volume to market cap ratio was at 1.96%, suggesting moderate activity levels.
Consolidation Continues While Momentum Lags
XRP’s price movement shows a continued consolidation. Since early May, the asset has posted lower highs and horizontal lows, staying range-bound after a downtrend from the March–April peak between $2.85 and $3.00.
Notably, XRP has failed to push above resistance at $2.20, while support remains close to $2.10. Daily ranges have narrowed further, with June 21’s low at $2.11 and high at $2.13, indicating restrained volatility.
Trading volume reached 7.89 million XRP, typical for a range-bound market and not indicative of major buy or sell pressure. Adding to the indecision, the RSI is at 42.67, below the neutral 50 mark. This positioning suggests weak buying momentum.
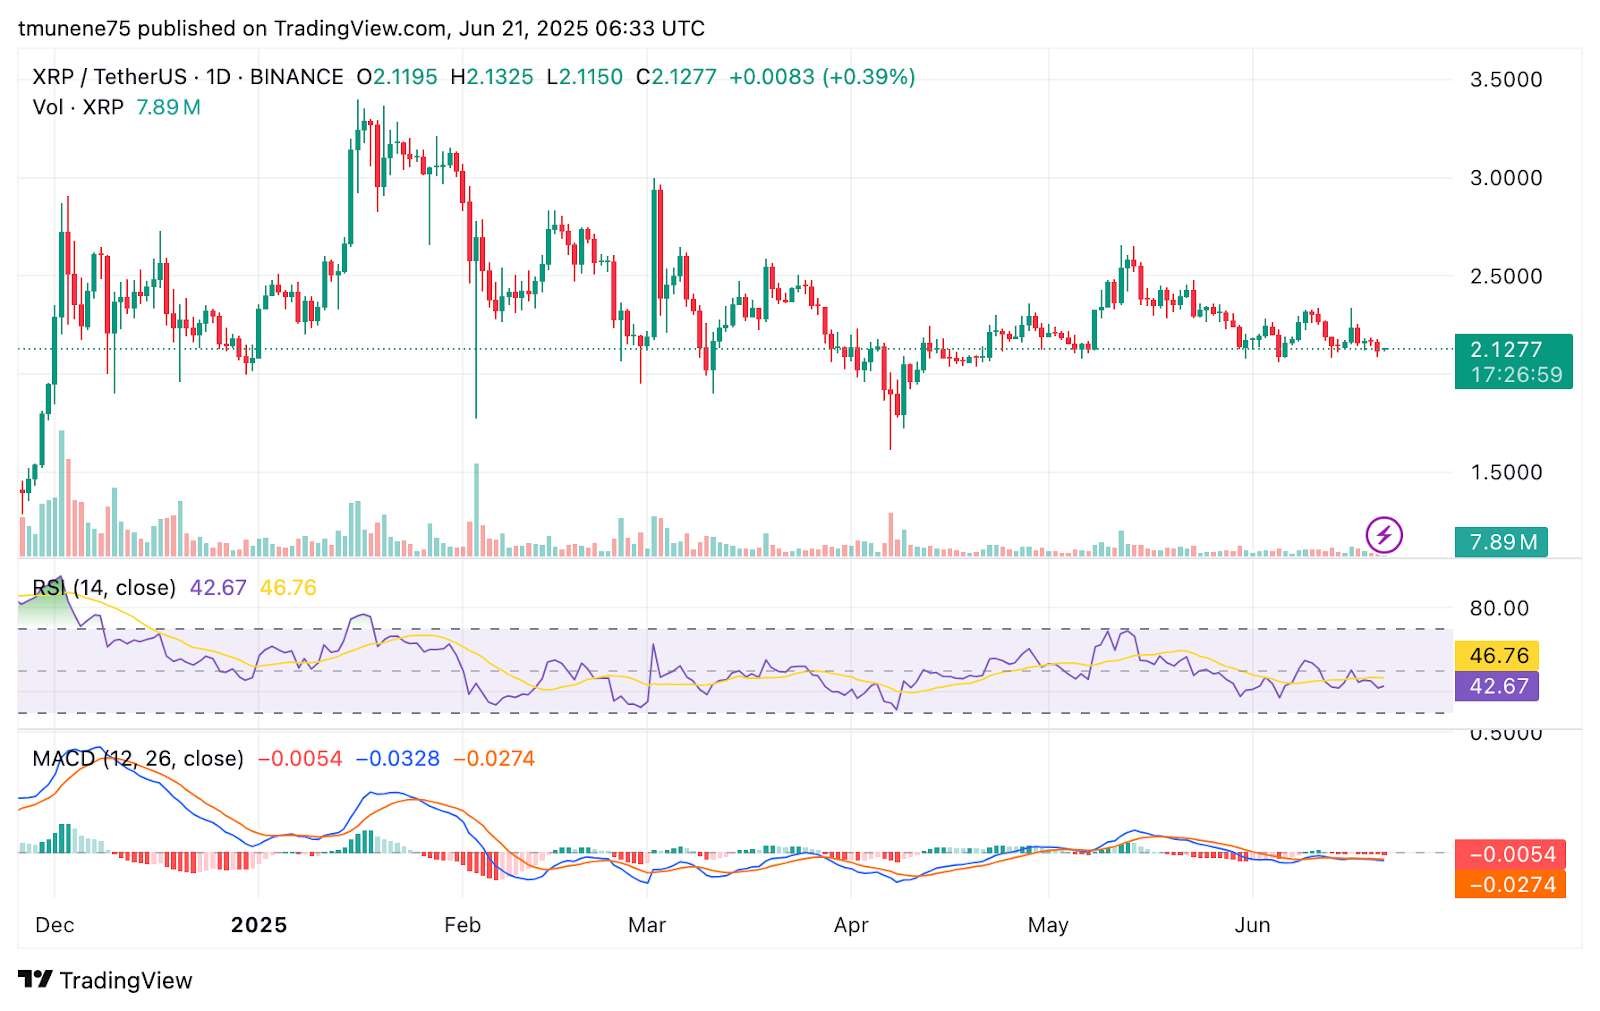
Meanwhile, the RSI moving average is 46.76, supporting the bearish outlook. However, the MACD line has crossed above its signal line, forming a mild bullish divergence. Despite this, both values remain negative, suggesting that bearish sentiment still holds influence.
Moving Averages Shows Bearish Pressure
XRP is below key moving averages, with the 50-day MA at $2.17 and the 200-day MA at $2.24. This alignment is technically bearish. A death cross, when the 50-day average dips below the 200-day average, was formed early April.
Since then, XRP has failed to reclaim either average, indicating continued rejection at higher levels. February highs above $3.30 remain distant, while current resistance is at $2.24 and $2.31. Immediate support is firm between $2.09 and $2.10.
Drop in User Activity But Steady Holder Growth
On-chain indicators show contrasting trends. Daily active addresses dropped substantially from over 240,000 in early June to just 14,200, suggesting lower network activity. However, total holder count continues to climb, now at 6.58 million.
This rise points to consistent long-term holding behavior despite near-term volatility. The difference between falling activity and rising holder numbers shows mixed market confidence in the short-term.
Potential Price Scenarios for June 22, 2025
On the upside, if XRP breaks above $2.17 and holds, a move toward $2.25–$2.30 is possible, especially with higher trading volume. However, if the price falls below $2.10, XRP could decline to $2.05 or even $2.00 amid weak network activity and macro pressures.
Overall, XRP remains in a tight consolidation phase with pressure from both sides of the market. Price is locked between $2.10 support and resistance near $2.20. While indicators suggest weakening momentum, a spike in volume or address activity could change the direction. Moving averages and on-chain trends show a cautious stance, with markets monitoring for a breakout or breakdown in the short-term.


