
- In May 2025, U.S. M2 money stock reached a new high of $21.94 trillion.
- The annualized 4.5% growth rate is less than the 25-year average of 6.3%.
- It is the first time it has exceeded the previous peak of $21.86 trillion since March 2022.
United States money supply M2 has reached an all-time record high of $21.94 trillion in 2025. This component, which includes cash, checking deposits, and other extremely liquid assets, rose by 4.5% from the equivalent month in 2024.
This growth is a shift back to growth after a period of monetary tightening but it is below the 25-year average yearly growth rate of 6.3 % between the years 2000 and 2025. Recent numbers exceed the prior peak of $21.86 trillion in March last year, concluding a two-year period of modest liquidity growth.


Slower Growth Signals Ongoing Recovery
Though M2 supply reached an all-time high, the 4.5% year-over-year rate is behind trends. M2 grew by an average of 6.3% year between 2000 and 2025. New rises, however, point to renewed activity in the financial system.
Federal Reserve data indicates a steady increase during the last years of 2023 up to the beginning of the second half of 2025, with a notable decline during 2022 and the start of 2023.
That previous contraction came on the heels of explosive growth in the 2020–2021 period, as M2 supply rose sharply on account of unprecedented fiscal and monetary interventions.
Post-2022 Recovery Ends Nearly Three-Year Plateau
The previous high of $21.86 trillion in March 2022 was not threatened until May 2025. After the high, the M2 supply contracted for several months, driven by tightening policies and diminished stimulus. But starting in late 2023, the trend reversed.
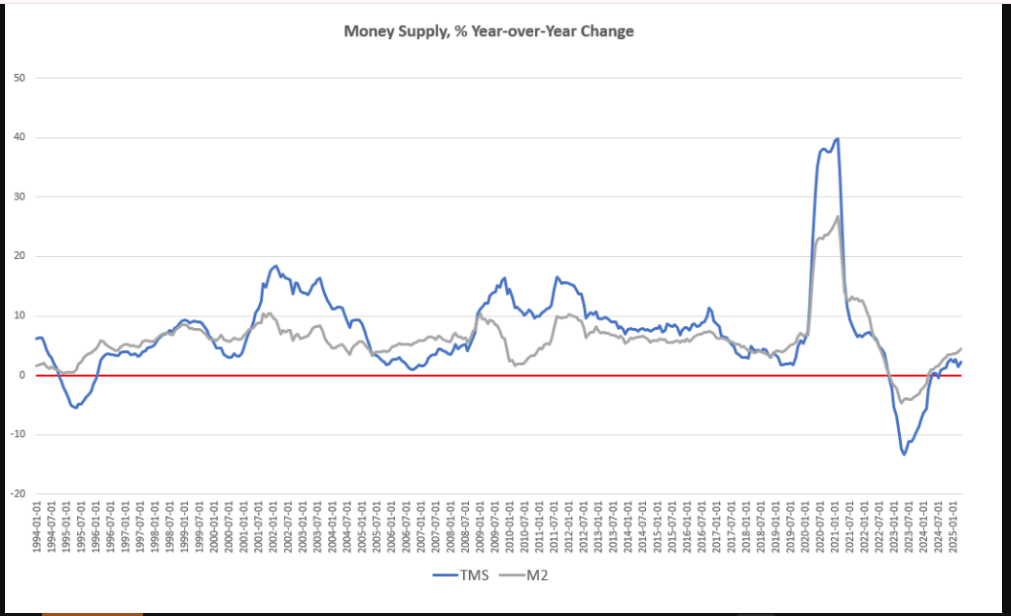
The graph shows a consistent uptrend during 2024 into 2025, with monthly increases increasingly gaining momentum. May’s print breaks the streak of stagnation, bringing M2 well above previous levels for the first time in over three years.
Sustained Uptrend Suggests Continued Liquidity Expansion
As of the end of May 2025, the money supply M2 is $21.94 trillion, continuing to rise steadily beyond its past top. The monthly data registered a 0.36% improvement over the last month, complemented by the 4.5% increase on an annual basis.
Notably, the present trend appears to suggest an extended reversal of past contractions. Though still moderate, the general trend since late 2023 completely substantiates a broad-based recovery in the money supply curve. The trend captures shifting liquidity dynamics from the earlier post-pandemic tightening phase.


