
- TRUMP has dropped by 50.27% in a month, testing $12.50 support; a break lower could push prices to $12 or $10.50.
- Futures open interest fell to $200M, down from $1B, indicating reduced speculative demand and lower market activity.
- RSI at 28.88 signals oversold conditions, but MACD remains bearish; recovery depends on increased buying volume.
TRUMP has dropped by 50.27% in the past month, trading at $13.00 at press time. The decline raises concerns about further downside risks. TRUMP Market cap has had a slight increase of 0.45%, reaching $2.6 billion.
Meanwhile, the 24 hour trading volume has dropped by 34.56% to $958.56 million, indicating reduced trading activity. The token’s fully diluted valuation is at $13.03 billion, with a volume-to-market cap ratio of 36.91%.


Steady Decline and Support Levels
TRUMP has followed a downward movement since hitting highs of $26, showing continued selling pressure. Over the past 4 hours, the price has traded between $12.77 and $13.10, indicating limited volatility in the short term.
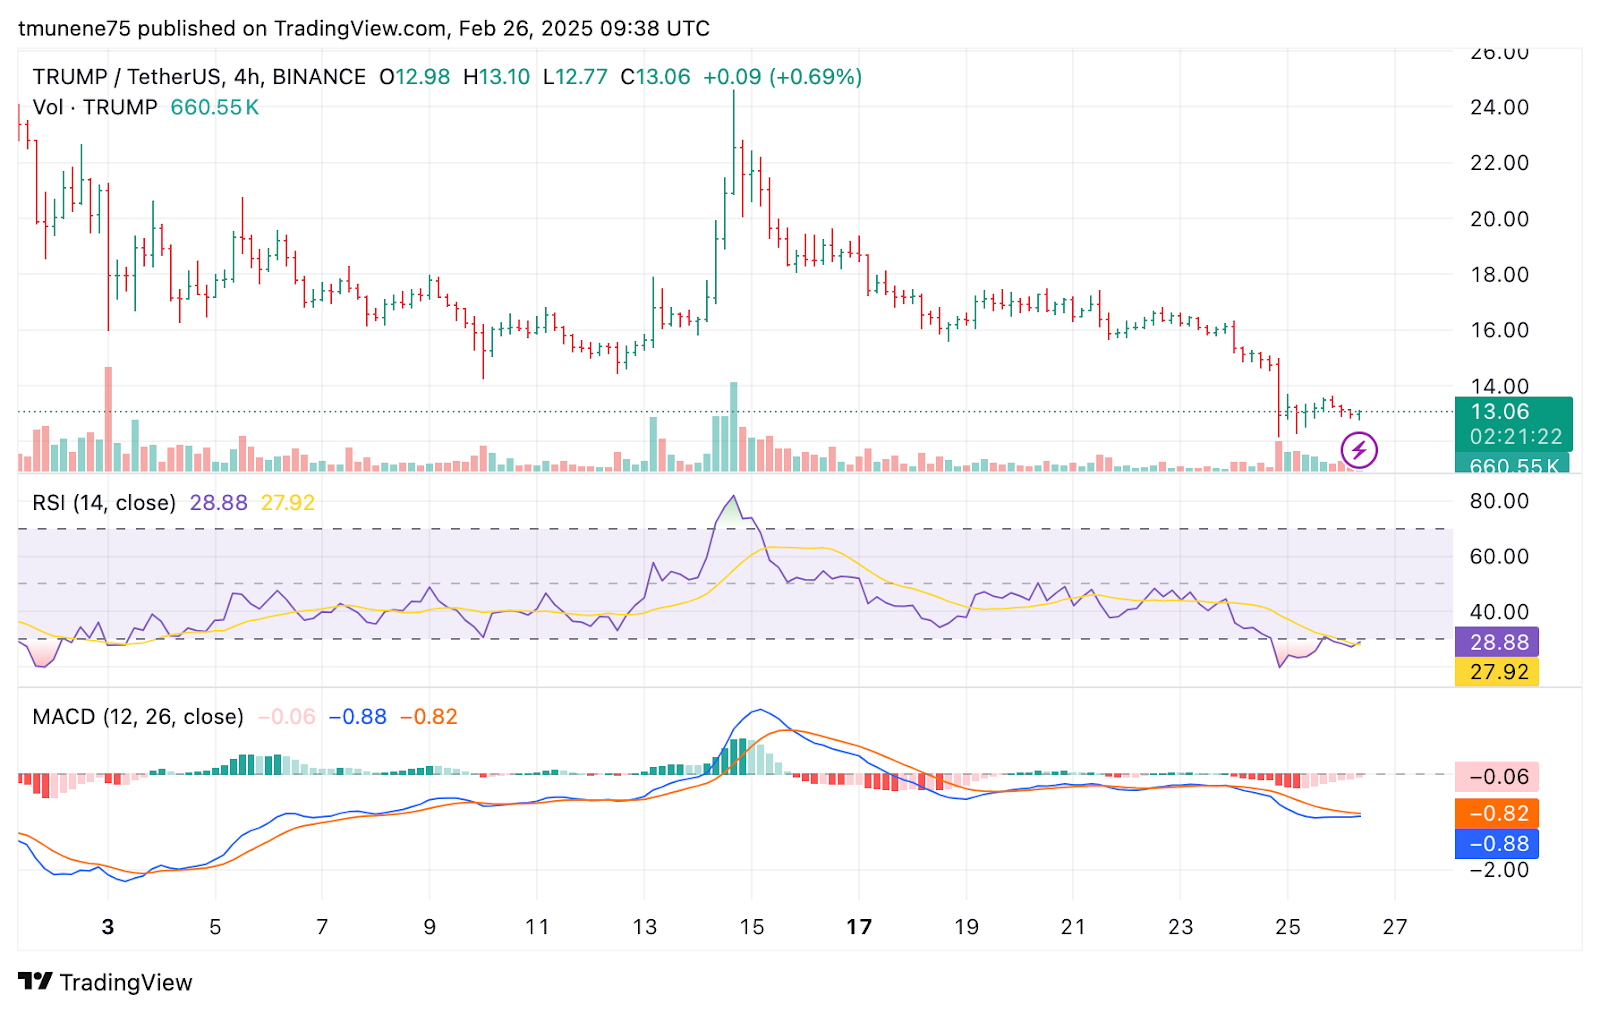
Key support is at $12.50, where buyers may attempt to stabilize the price. However, if the support breaks, TRUMP could slide toward $12 and $10.50. Immediate resistance is at $14, and breaking above this level could lead to a recovery towards $16.
The RSI is at 28.88, placing TRUMP at an oversold level. Typically, an RSI below 30 suggests an asset might be undervalued. However, this does not confirm a reversal unless accompanied by increased buying volume.
The MACD indicator is bearish, with the MACD line at -0.88 and the signal line at -0.82. The negative divergence and histogram reading of -0.06 indicate continued downward momentum. A bullish crossover could suggest a potential rebound if buying pressure intensifies.
Futures Market Trends and Open Interest Movements
The TRUMP futures market has also had substantial shifts in trader sentiment. Open interest remained near zero from January 2 to January 17, indicating minimal speculative activity.
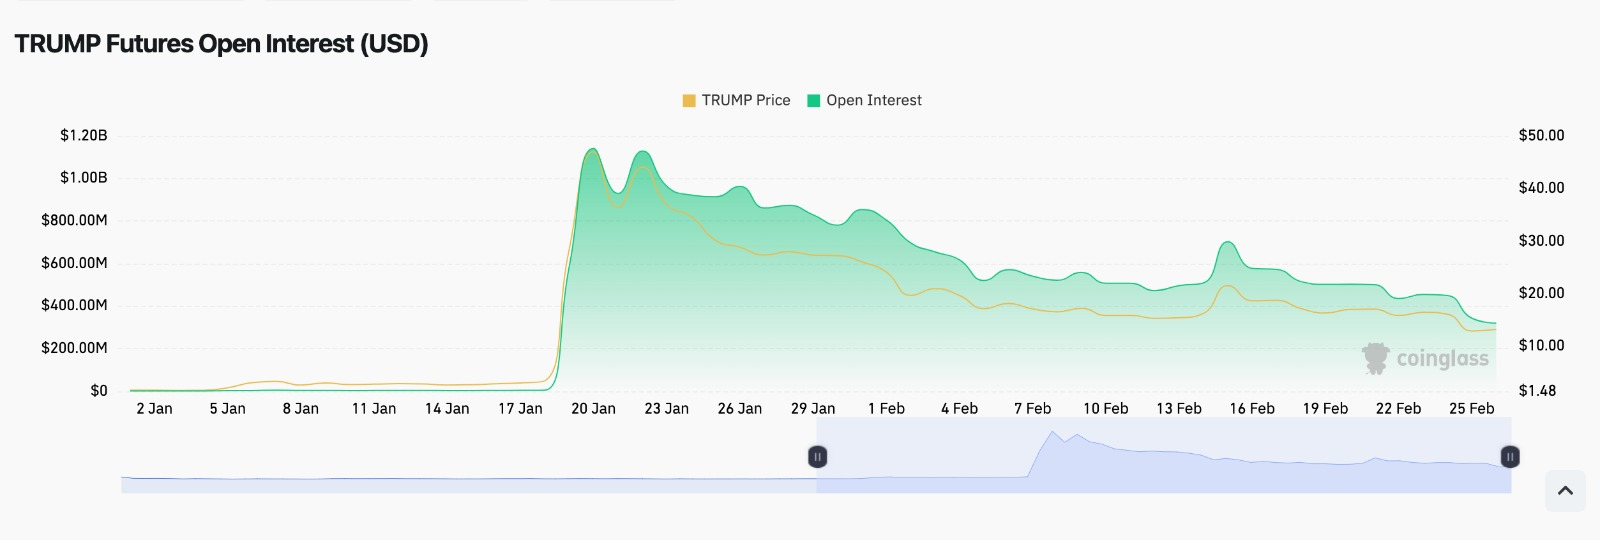
However, between January 17 and January 20, open interest surged beyond $1 billion, suggesting a wave of new futures positions. This increase coincided with a price jump, indicating the link between speculative trading and price movements.
After peaking above $1 billion, open interest gradually declined, settling between $400 million and $800 million in early February. The price followed this decline, implying that traders either closed positions or were liquidated.
As of February 25, open interest dropped to $200 million, aligning with TRUMP’s fall below $20. The reduced open interest suggests diminishing speculative demand, which may contribute to lower price volatility in the near term.
Price Outlook and Levels to Watch
TRUMP has a crucial test at the $12.50 support level. Holding above this point could lead to a relief rally toward $14 and, if momentum sustains, a potential push to $16. However, a break below $12.50 could lead to further declines to $11.50 and $12.
In the futures market, a resurgence in open interest could indicate renewed trader interest, potentially pushing TRUMP back toward $25-$30. However, continued declines in open interest may suggest reduced market activity, limiting potential gains.
The market is reactive to speculative flows, with price movements aligning futures data. Overall, TRUMP’s recent drop shows the risks of extended downturns, with crucial price levels determining its next move.


