
- SHIB faces strong resistance at $0.00001555-$0.00001560, limiting breakout potential.
- Declining trading volume and a death cross signal bearish momentum ahead.
- RSI nearing oversold territory could trigger a rebound if buying interest rises.
Shiba Inu (SHIB) is at a crucial price level, trading at $0.00001537 after a slight 0.26% decline in the past 24 hours. The price has been fluctuating within a tight range, indicating uncertainty among traders. With a drop in trading volume and bearish signals from technical indicators, the market is at a turning point. The question remains whether SHIB will break out of this range or continue to stagnate.
Support and Resistance Levels Define the Market Outlook
SHIB has established key support and resistance levels, which could determine its next move. The support zone lies between $0.00001531 and $0.00001533, where buyers have stepped in during past dips.


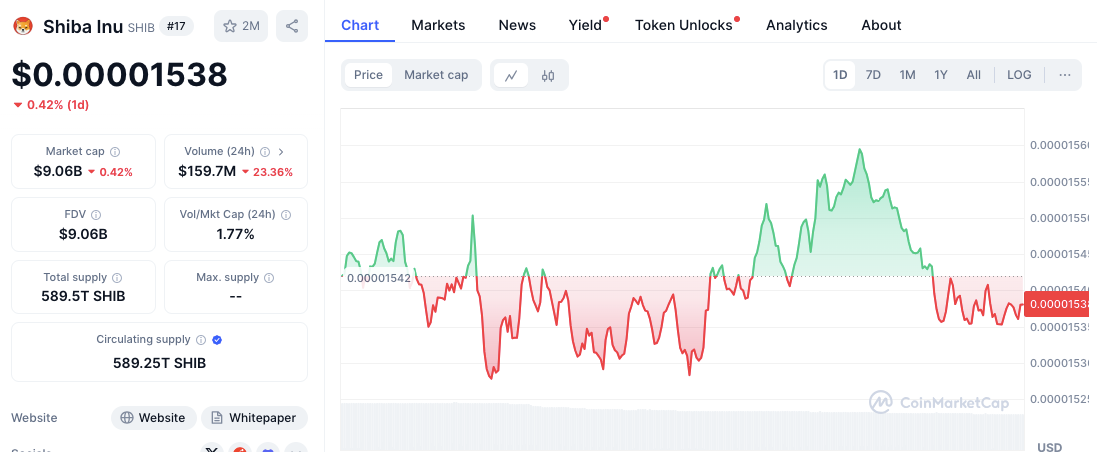
Resistance has formed between $0.00001555 and $0.00001560, a level where selling pressure has emerged. A breakout above resistance could drive the price toward $0.00001580, while a breakdown below support may lead to further declines.
Technical Indicators Suggest Weakening Momentum
The current price action suggests bearish pressure, with a notable 22.72% drop in trading volume. This decline in volume indicates reduced buying interest, making a breakout less likely in the short term.
Additionally, a recent death cross has appeared, where the short-term moving average has crossed below the long-term moving average. This formation signals a potential downtrend, though historically, it can also precede a market reversal if buying interest strengthens.
Coinglass SHIB’s derivatives market also reflects declining interest. Trading volume in derivatives dropped by 32.47% to $72.14 million, while open interest saw a slight 0.52% decline to $202.39 million. These figures suggest reduced speculation, which could lead to a period of lower volatility unless a major catalyst emerges.
RSI and MACD Indicate a Potential Turning Point
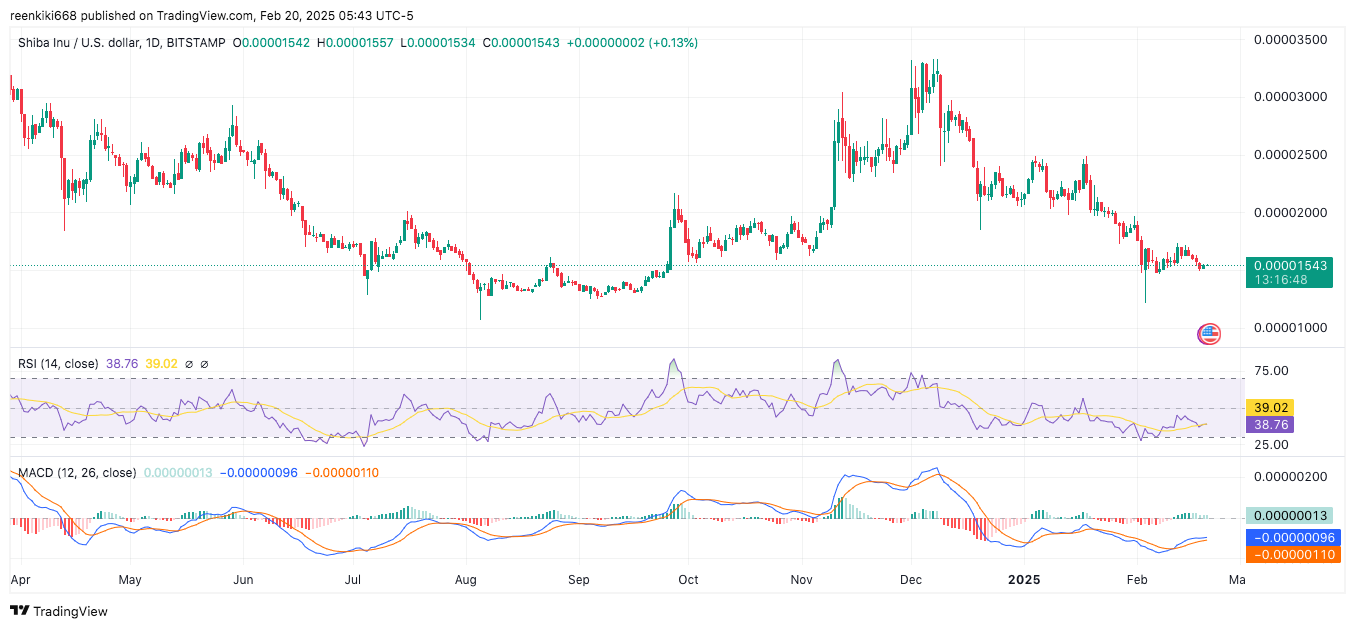
The Relative Strength Index (RSI) currently stands at 38.76, showing a bearish trend but approaching oversold territory. If RSI falls below 30, it could trigger a rebound as traders perceive SHIB as undervalued.
The Moving Average Convergence Divergence (MACD) further supports the bearish outlook. The MACD line remains below the signal line, with a negative histogram, suggesting continued downward pressure. However, a crossover of the MACD line above the signal line could signal a potential reversal.


