
- SHIB’s breakout from a Falling Wedge pattern hints at a possible 422% price surge if momentum sustains.
- Key resistance at $0.00001551; breaking it may push SHIB toward $0.0000165. Support at $0.0000149 remains crucial.
- MACD suggests bullish momentum, but RSI at 38.46 indicates weak buying strength. A rise above 50 could confirm an uptrend.
SHIB has maintained unfavorable price trends during the previous month yet two essential technical indicators pointed towards upcoming growth.According to information from SHIB Bezos, Shiba Inu (SHIB) has recently shown a breakout from a significant Falling Wedge pattern suggesting that this breakout could lead to a substantial price increase, possibly driving SHIB towards new all-time highs.
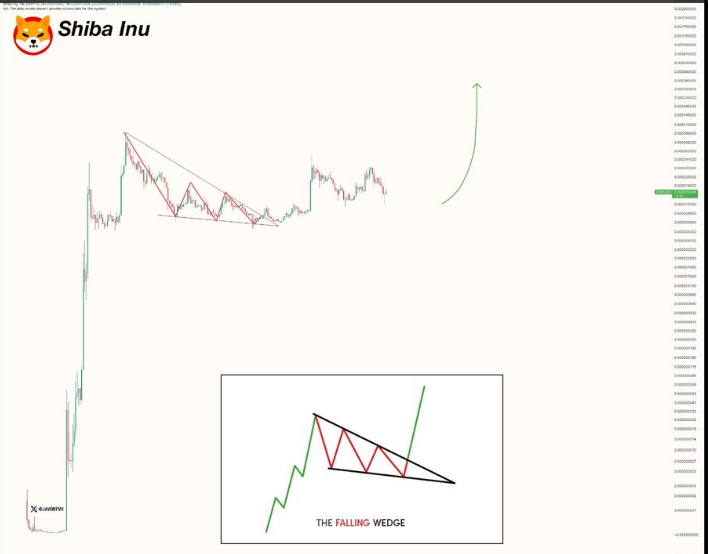


Historical data shows that similar formations in cryptocurrency markets have preceded significant price increases. If SHIB maintains momentum, analysts estimate a potential gain exceeding 422%, with projections pointing towards the $0.00008841 level or higher.
SHIB’s Market Movement and Price
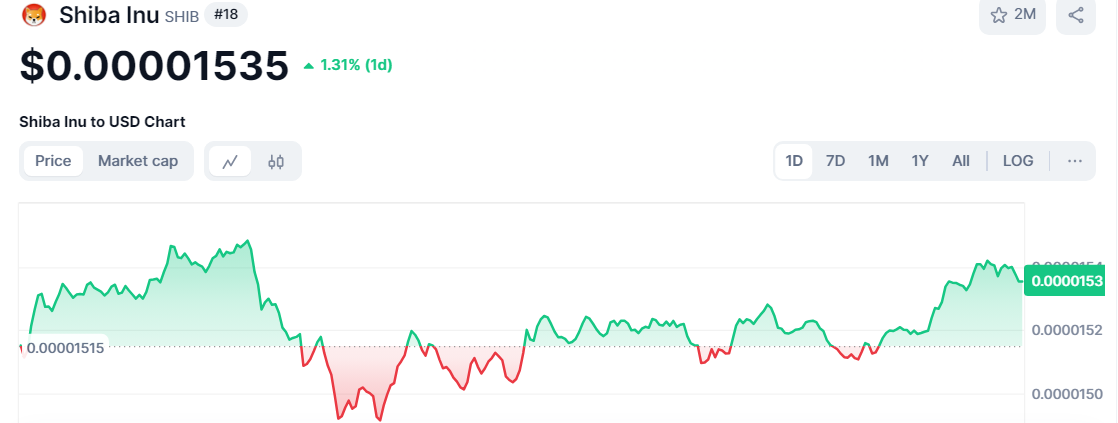
The market value of Shiba Inu stands at $0.00001535 with a 1.31% upward movement observed during the past day. SHIB experienced average volatility during the 24-hour period showing prices between $0.0000149 and $0.00001551.
The established support point at $0.0000149 demonstrates ongoing buying momentum yet the price needs to surpass resistance at $0.00001551 to drive a bullish momentum. SHIB has the potential to start an upward movement towards $0.0000162 – $0.0000165 if it surpasses its current resistance point.
Market trends show SHIB gained 0.8% against Bitcoin yet dropped 0.3% against Ethereum in this period. The exchange value of SHIB demonstrates partial market independence despite its current benefit from rising market conditions. An uptick in Bitcoin or Ethereum values would create additional momentum for SHIB to rise in price.
Technical Indicators Show Mixed Signals for SHIB’s Momentum
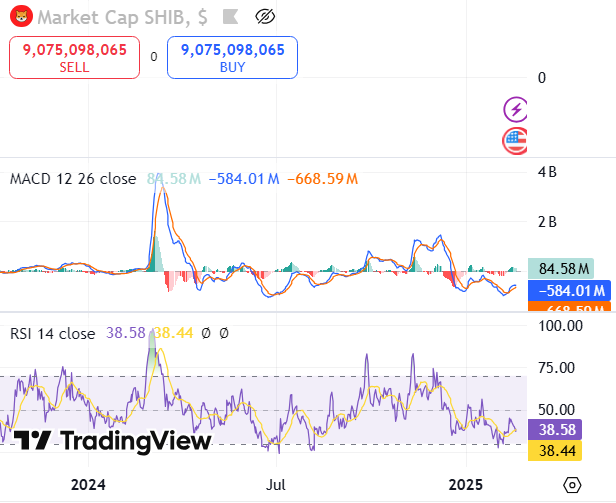
The MACD is trading above the signal line showing positive momentum. A sustained upward movement in the MACD line could confirm a bullish shift, but for now, the trend remains uncertain.
The RSI indicator currently measures 38.46 while its secondary reading shows 38.43 which positions SHIB lower than the key 50-level. Weak momentum indicated by declining RSI metrics suggests bearish market conditions might appear if the decline persists and leads SHIB toward an oversold range.
However, unless the RSI climbs above 50 and the MACD crosses into positive territory, SHIB may struggle to gain upward momentum.
Key Levels for February 20
A conservative market shift could drive SHIB to reach values between $0.0000147 and $0.0000145 assuming adverse conditions persist throughout other markets. The bullish prediction for SHIB remains intact as long as price stays above $0.0000149. This may lead to additional value growth toward the $0.00001540 and $0.00001550 mark.


