
- SEI tests a critical demand zone, signaling a potential liquidity grab before reversal.
- TD Sequential buy signal suggests trend exhaustion, with key resistance at $0.20–$0.21.
- RSI nears oversold, but weak MACD signals indicate bulls must sustain momentum.
The price of Sei (SEI) is currently navigating a critical demand zone following a significant retracement. After touching a low of $0.1717, SEI has rebounded to $0.1918, marking a 5.73% recovery. Despite a 1.68% increase in the last 24 hours, SEI remains down 16.52% over the past week. Analysts suggest a potential reversal if key technical signals align with bullish momentum.
Testing Critical Demand Zone
Market analyst BullishBanter highlights that SEI is testing a critical demand zone after experiencing a sharp decline. A weak low appears to be forming, which could indicate a potential liquidity grab before a reversal takes place.


If the price sweeps below recent lows and confirms a bullish structure, SEI could rally toward the $0.25–$0.30 supply zones. This outlook aligns with historical price action, where similar formations have led to sharp rebounds.
Buy Signal from TD Sequential Indicator
Ali Martinez, another market analyst, points out that SEI has triggered a buy signal on the daily chart based on the TD Sequential indicator. The SEI/USDT pair on Binance recently flashed a TD Sequential “9” buy signal, historically a sign of trend exhaustion and potential reversal.
$SEI is flashing a buy signal on the daily chart, according to the TD Sequential indicator, signaling a rebound on the horizon. pic.twitter.com/joyuG6H5q8
— Ali (@ali_charts) March 11, 2025
Following this signal, a bullish engulfing candle has emerged, reinforcing early buying interest. If this momentum continues, SEI could face its next resistance near $0.20–$0.21, while support remains around $0.18. A breakout above the descending trendline could further strengthen bullish sentiment.
Technical Indicators Reflect Mixed Signals
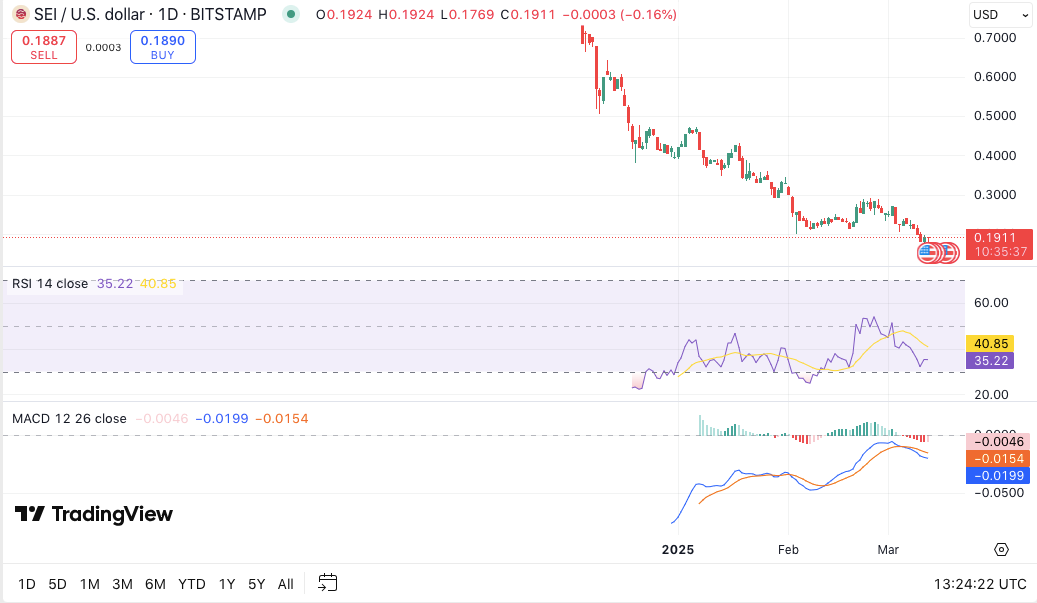
From a technical perspective, the Relative Strength Index (RSI) is currently at 35.22, suggesting that SEI is approaching oversold territory. If the RSI rebounds from this level, it could trigger a short-term recovery. However, the previous RSI peak at 40.85 suggests weak buying pressure, indicating that bulls must sustain momentum for a confirmed reversal.
Meanwhile, the Moving Average Convergence Divergence (MACD) indicator presents a bearish outlook. The MACD line (-0.0199) remains below the signal line (-0.0154), pointing to ongoing downward pressure. If the MACD histogram begins to show positive divergence, it could be an early indication of a potential reversal.


