
- Whale James Wynn offloads 240B PEPE, signaling possible shift toward Bitcoin.
- Technical wedge and Elliott Wave suggest PEPE may enter impulsive rally phase.
- Liquidation zones near $0.0142 could trigger volatility before breakout continuation.
Pepe (PEPE), the popular meme coin, is once again under the spotlight as significant on-chain activity and technical signals suggest a potential shift in trend. With recent moves by major holder James Wynn and an increasingly bullish chart structure, traders are now watching closely for a possible breakout.
As of press time, PEPE trades at $0.00001378, posting a slight dip over the past 24 hours and week. Despite this mild downturn, both on-chain data and technical indicators point toward a potentially bullish resurgence.


Whale Activity Signals Market Shake-Up
According to data from Lookonchain, James Wynn, a known whale in the PEPE space, has made major moves. He recently sold 240 billion PEPE tokens for $3.32 million, reportedly to fund a long position on Bitcoin.
Following that, he transferred the remaining 203.73 billion PEPE (valued at $2.82 million) to Binance. This indicates he may be preparing to exit his PEPE position entirely.
Such large-scale movements from influential holders often impact short-term market sentiment. Consequently, traders have turned cautious, anticipating either further sell pressure or a shift in capital toward more stable assets like Bitcoin.
Technical Setup Hints at Bullish Reversal
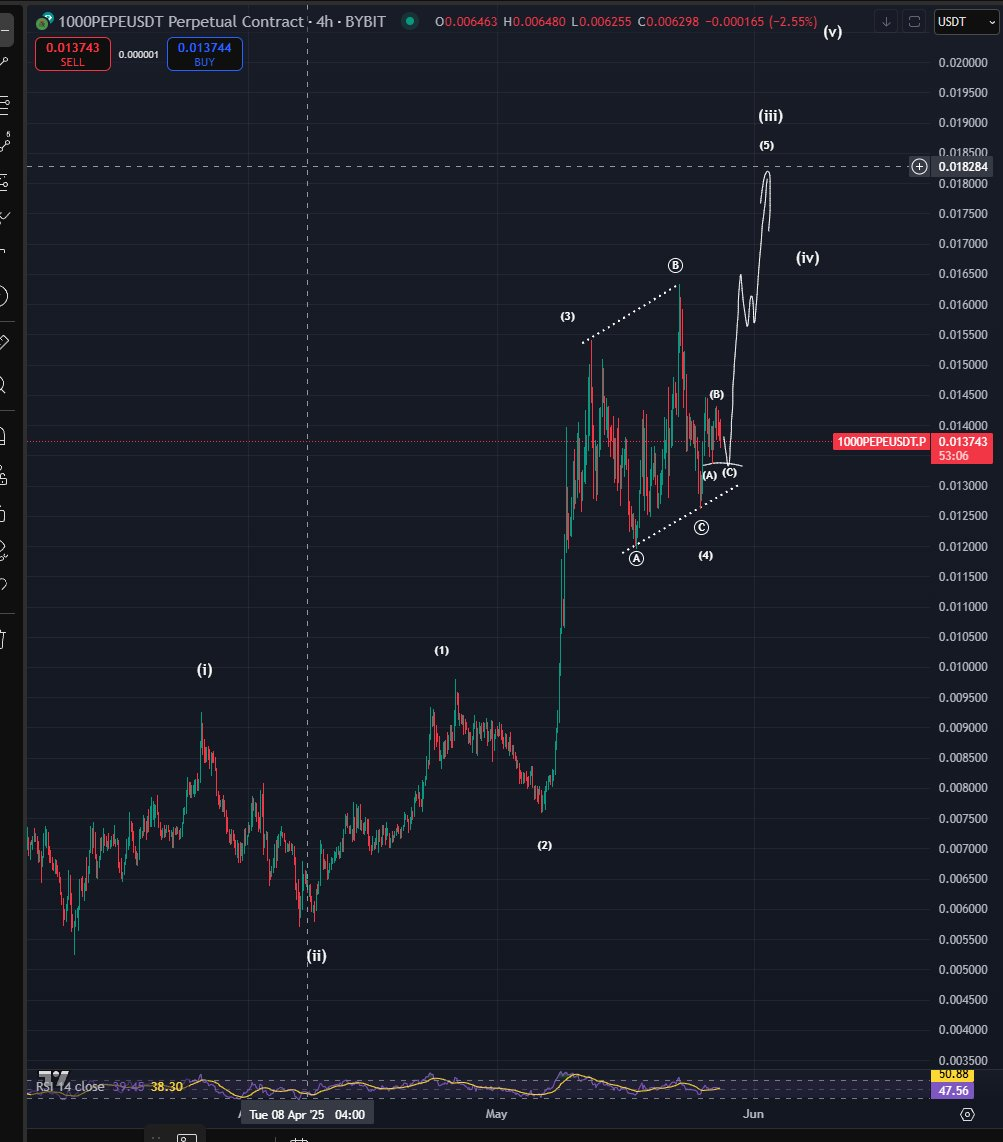
Despite the whale sell-off, technical patterns suggest PEPE could be staging a comeback. Bluntz_Capital, a respected crypto analyst, notes a bullish Elliott Wave structure forming. According to his analysis, PEPE has completed Wave (4) and may be entering the impulsive Wave (5) phase.
Source: X
After last week’s 22% pullback, PEPE held firm at the 0.0125 support level. A bullish wedge has since formed, with key breakout points at 0.0145 and 0.0155. Breaking through these zones could lead to a strong rally toward 0.0185–0.0190.
Liquidation Zones and Technical Indicators
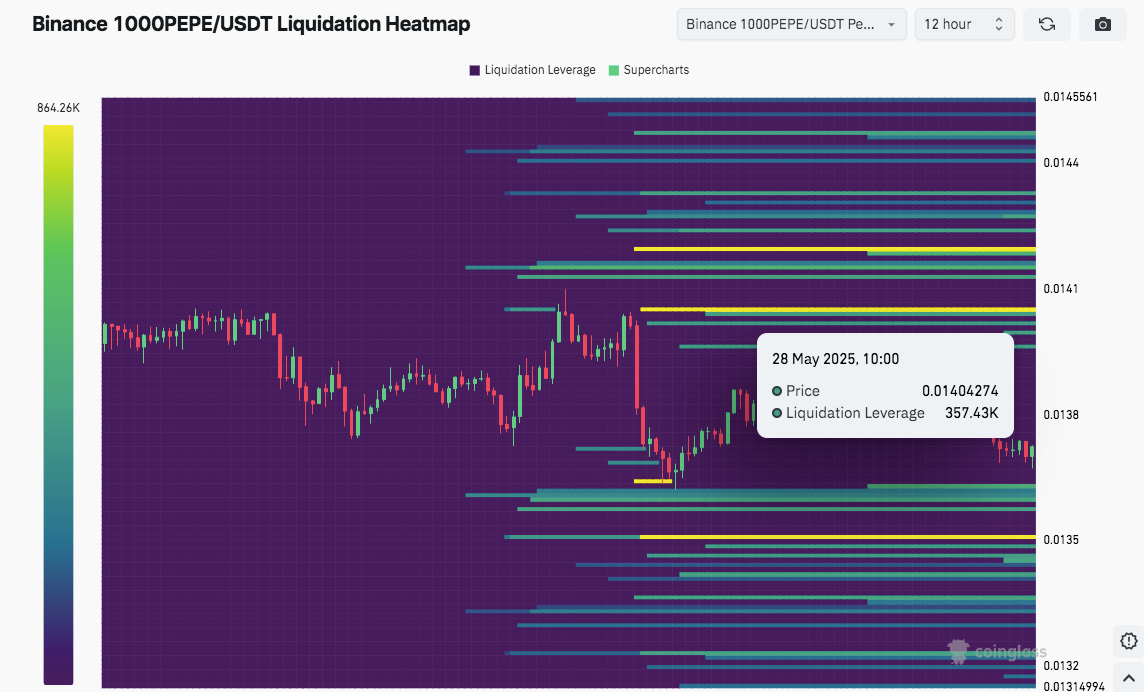
Source: Coinglass
The Binance liquidation heatmap for 1000PEPE/USDT highlights dense leverage clusters between 0.0140 and 0.0142. These zones could act as temporary resistance as traders’ stop-loss orders get triggered. The largest liquidation level is currently 864.26K, showing high interest from leveraged positions.
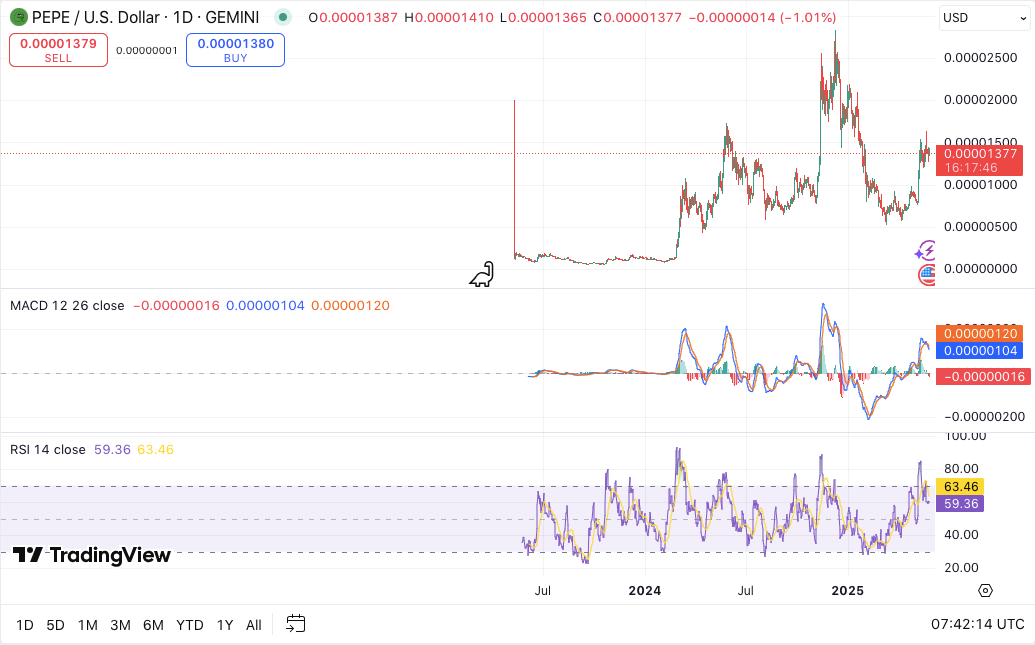
PEPE/USD daily price chart, Source: TradingView
On the technical front, the MACD histogram is slightly negative. This suggests fading bullish momentum, but not a full reversal. The RSI, currently at 59.36, remains in the neutral-to-bullish range. This indicates room for growth without entering overbought territory.


