
- Optimism struggles as bearish pressure pushes price below key resistance zones.
- RSI at 39.72 signals weakness, while MACD confirms ongoing bearish momentum.
- OP faces strong support at $1.05, with $1.00 as the next critical defense zone.
Optimism (OP) has faced significant bearish pressure, with the price dropping to $1.09 amid heightened market volatility. The token has recorded a 6.52% decline over the last 24 hours and a 5.99% loss over the past week.
The increased selling pressure has pushed OP below key resistance levels, raising concerns about further downside potential. However, strong support zones may limit losses and provide opportunities for a possible rebound. Investors are closely watching market conditions, technical indicators, and key price levels to gauge OP’s next move.


Price Trends Indicate Bearish Sentiment
Optimism showed early signs of strength, briefly surging above $1.16 before experiencing a sharp sell-off. The token’s failure to sustain gains suggests the formation of a downtrend, characterized by lower highs and lower lows.
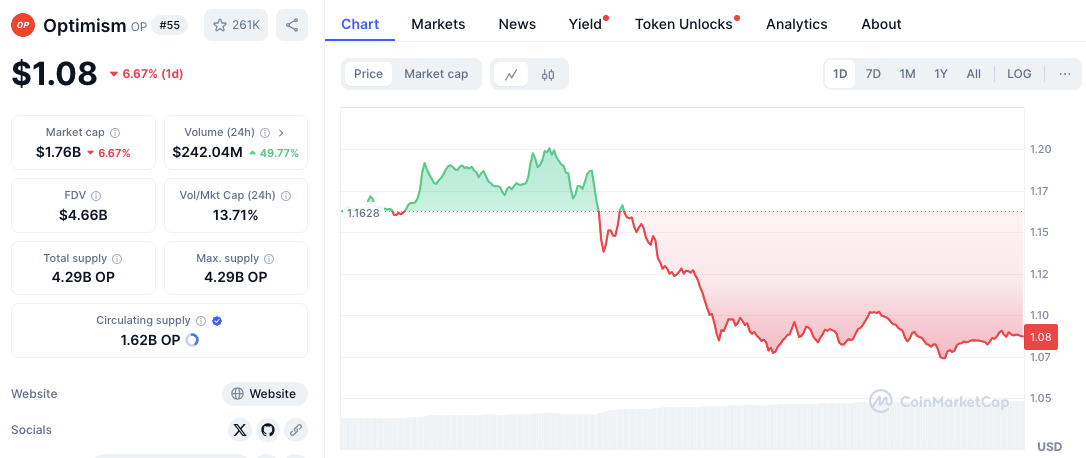
A 49.57% surge in trading volume highlights increased market activity, indicating strong participation from both buyers and sellers. However, persistent bearish sentiment could keep prices under pressure in the near term. If the token fails to hold above crucial support levels, further losses may follow.
Crucial Support and Resistance Levels
Key support levels for OP include $1.05, which has acted as a strong floor in previous trading sessions. If selling pressure intensifies, the psychological barrier at $1.00 could serve as another crucial level where buyers may step in. A deeper decline could push OP toward $0.95, a level that may provide substantial support.
On the upside, the immediate resistance stands at $1.12, a level where sellers have previously emerged. If OP breaks above this threshold, it could target the $1.16–$1.18 resistance zone, marking the recent high before the downturn. A decisive move past $1.20 would signal bullish momentum and potentially reverse the current trend.
Technical Indicators Suggest Further Weakness
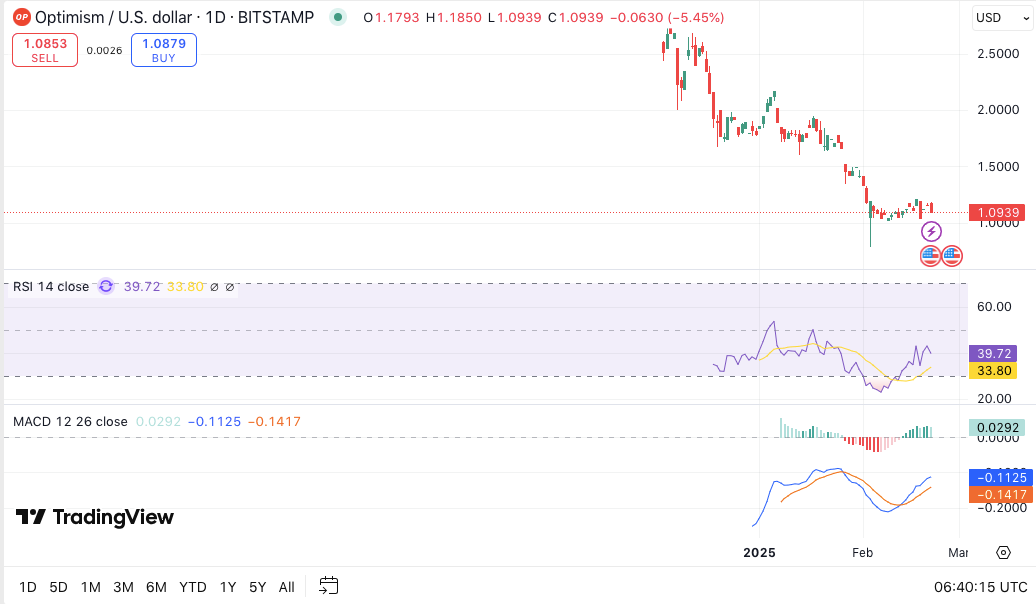
The Relative Strength Index (RSI) currently stands at 39.72, indicating bearish conditions but not yet signaling oversold territory. If the RSI drops below 30, it may trigger a rebound as buyers step in.
Meanwhile, the Moving Average Convergence Divergence (MACD) remains negative, with the MACD line below the signal line, reinforcing the bearish outlook. Negative histogram bars further indicate downward momentum, suggesting that sellers remain in control.
Market Outlook for February 2025
Despite current bearish sentiment, Coincodex analysts predict significant upside potential for OP in February 2025. Price projections suggest a possible surge of up to 99.80%, with an average price target of $2.18. The anticipated price range extends from $1.16 to $3.92, offering a potential return of 259.83% from current levels.


