
- PEPE faces resistance at $0.00001018 as bulls struggle to reclaim recent highs.
- RSI near oversold and MACD bearish hint at possible base before next move.
- $963K in liquidations at peak signals stress and potential for a rebound base.
Pepe (PEPE), one of the most talked-about memecoins, is once again under the market microscope as it approaches a crucial technical junction. With high volatility and aggressive trading volumes, the coin finds itself at a decision point either confirm a bullish rebound or risk a further downturn.
Despite a promising rally early in the day, PEPE struggled to maintain its highs, leading many traders to question whether this momentum is fading or simply consolidating before the next big move.


Current Trend and Price Action
As of press time, PEPE is trading at $0.00001006, down 1.93% in the past 24 hours. The price showed early strength, briefly peaking at around $0.00001018.
However, sellers stepped in, pushing it down to a low of $0.00000945 before partial recovery set in. This sequence of a sharp drop followed by sideways consolidation suggests indecision in the market.
Key resistance stands at $0.00001018, a level where price action was rejected earlier. A secondary resistance lies at $0.00001012, showing further signs of buyer fatigue.
On the downside, the $0.00000945 level holds as a critical support, having absorbed selling pressure earlier in the session. A softer support is forming around $0.00000980, where some buyers returned.
Volume, Momentum, and Market Sentiment
PEPE’s trading volume has surged to $764 million in 24 hours, a 60.26% increase. This uptick signals heightened activity, likely driven by recent price swings and potential news catalysts. With a volume-to-market-cap ratio at 18.12%, liquidity remains healthy and attractive for both day traders and long-term holders.
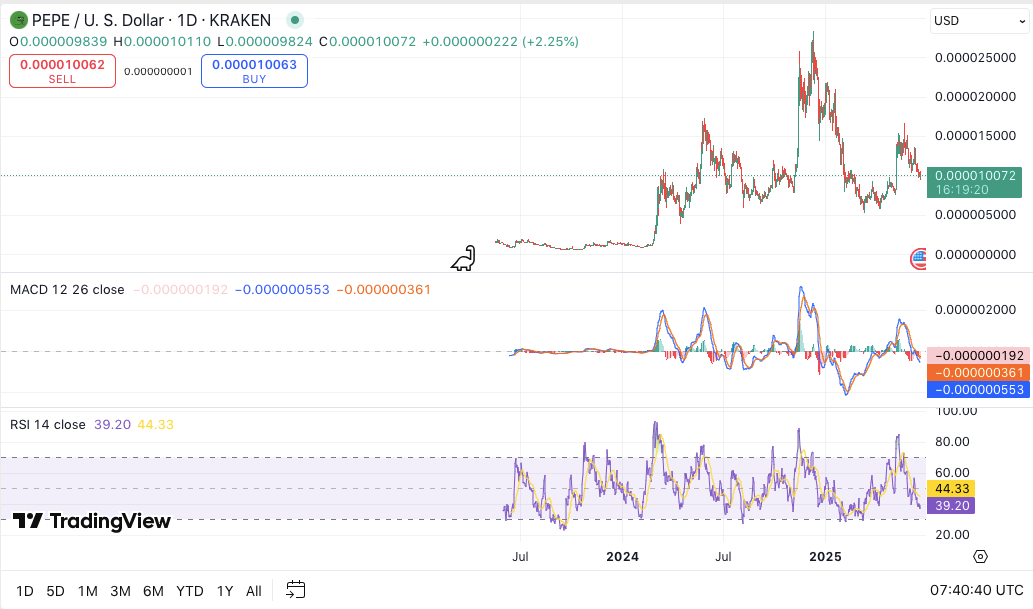
However, the MACD suggests caution. The MACD line is below the signal line, hinting at weakening bullish momentum. The histogram also supports this bearish lean. Meanwhile, the RSI at 39.12 is approaching oversold levels but hasn’t quite crossed into a reversal zone. This suggests that while downward pressure exists, the asset might soon find a base.
Leverage Liquidations and Future Outlook
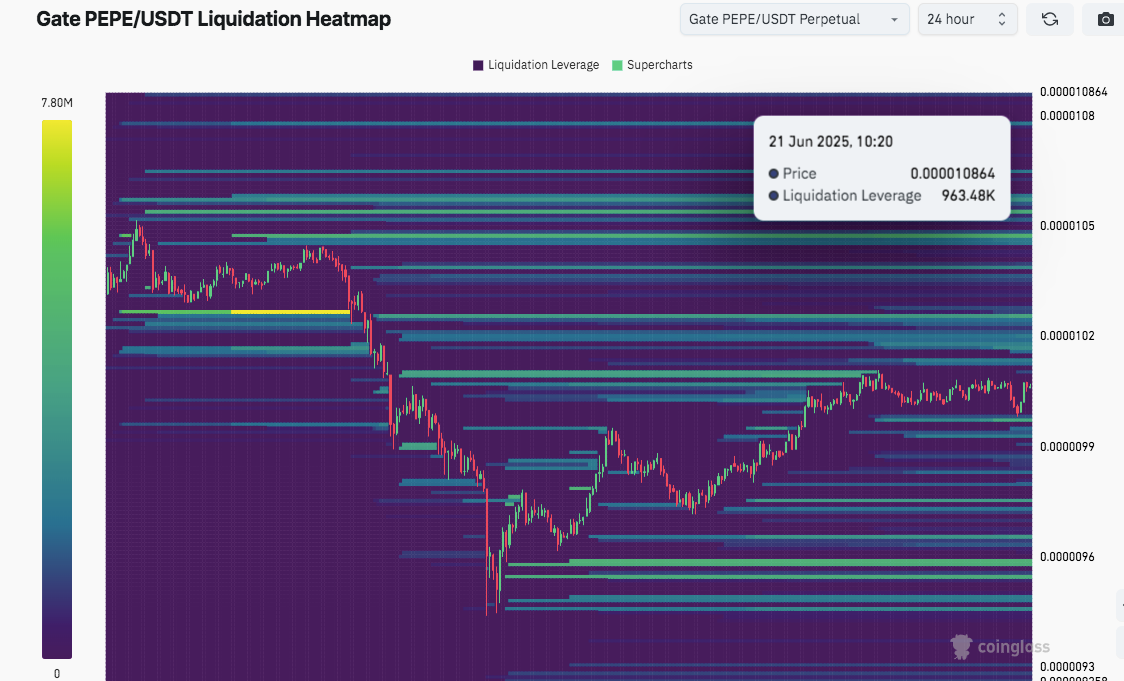
The liquidation heatmap reveals another layer of market stress. At the peak price of $0.000010864, over $963K in leveraged positions were liquidated. This aggressive unwinding shows that traders were caught off guard. Such events often lead to temporary bottoms as over-leveraged positions get flushed.


