
- For a bullish structure in the medium term, HBAR must remain above $0.124 or else a drop could lead to bearish trends.
- A 58.76% surge in trading volume contrasts with a 3.6% price drop and bearish MACD crossover, signaling potential downside.
- According to Coincodex, HBAR could lose a modest 0.27% over the next week, although the projected ROI is up by 1.17%.
Hedera (HBAR) is making waves in the enterprise blockchain sector with its innovative hashgraph consensus, enabling up to 10,000 transactions per second at low cost. However, HBAR’s price has recently dropped 3.6% over the past 24 hours, settling at $0.1878.
Meanwhile, volume has risen by 58.76% to $209.05 million, reflecting a sharp increase in market activity and increasing involvement. With rising demand, major support and resistance levels are being watched closely by traders to decide HBAR’s future outlook.


HBAR Holds Critical Support as Bulls Eye Breakout Potential
Hedera is attracting market attention as it moves towards a critical support level that could dictate its next substantial move. The token is currently resting close to $0.130—a break-or-make level for sustaining its short-term bullish configuration. According to analyst CryptoPatel’s observation, breaking out above this level and establishing a solid foundation could pave the way for a sustained rally, with targets from $0.50 to $1, provided underlying broader market momentum facilitates the breakout.
HBAR’s short-term setup appears to be supported by an accumulation area of $0.160-$0.180, where interest has gradually increased. Market analysts point to this range as a significant area that can sustain price strength in case buying continues to build up.
However, downside risks remain. Should HBAR drop below $0.124, it could invalidate the present structure, creating a shift in momentum toward a bearish outlook. Until then, everybody remains focused on if the $0.130 level will hold.
Technical Indicators Signal Bearish Shift
Several technical indicators signal weakening momentum in HBAR, to a reversal in a bearish trend in the short run. The Relative Strength Index (RSI) is at 44.22, meaning that the asset is still within a neutral zone but is gradually gaining positive momentum.
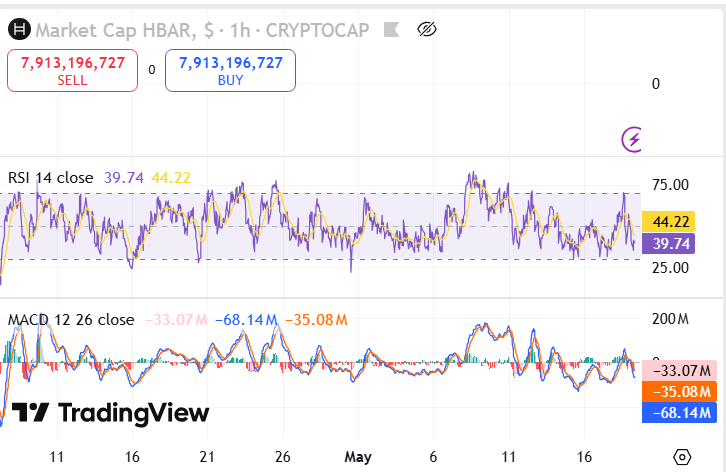
Meanwhile, the Moving Average Convergence Divergence (MACD) is showing a potential bearish crossover. The MACD line at -68.14 is heading lower and diverging from the signal line at -35.08. The move indicates building bearish momentum, and it makes a further move to the upside less likely in the near term.
HBAR Forecast Eyes Slight Dip Amid Positive ROI
According to Coincodex prediction, Hedera Hashgraph will reach the highest price of $ 0.185187 in the next 7 days which would represent 0.27% decline compared to the current price. This follows a 1.17% increase in Potential ROI.


