
- ETH nears $2,000 support; failure to hold could lead to $1,750 or lower, while a rebound may push prices toward $2,400.
- The MACD is bearish, with downward momentum persisting unless buying pressure strengthens above key resistance levels.
- Ethereum’s Bollinger Bands suggest potential oversold conditions, but weak volume raises concerns about recovery strength.
Ethereum (ETH) recently fell to $2,000, its lowest point since November 2023. According to Crypto Rover, ETH hit this level as part of its ongoing downtrend. On February 4, at press time, Ethereum was trading at $2,099.82, a 10.65% drop in the past 24 hours and a 12.64% decline over seven days.
💥BREAKING:$ETH HIT $2,000 FOR THE FIRST TIME SINCE NOVEMBER 2023. pic.twitter.com/GViFwe5dj5
— Crypto Rover (@rovercrc) March 4, 2025
Over the last month, ETH has plummeted by 32.35%. Data from CoinMarketCap shows 71% of 528.7K total votes are bullish, while 29% remain bearish. The question now is whether Ethereum can hold the $2,000 support level or continue its downward movement.


ETH Trading Near Key Levels
Ethereum’s price is near the lower Bollinger Band at $2,086.46, suggesting potential oversold levels. Historically, prices near this band tend to experience rebounds. However, sustained bearish pressure could push ETH lower.
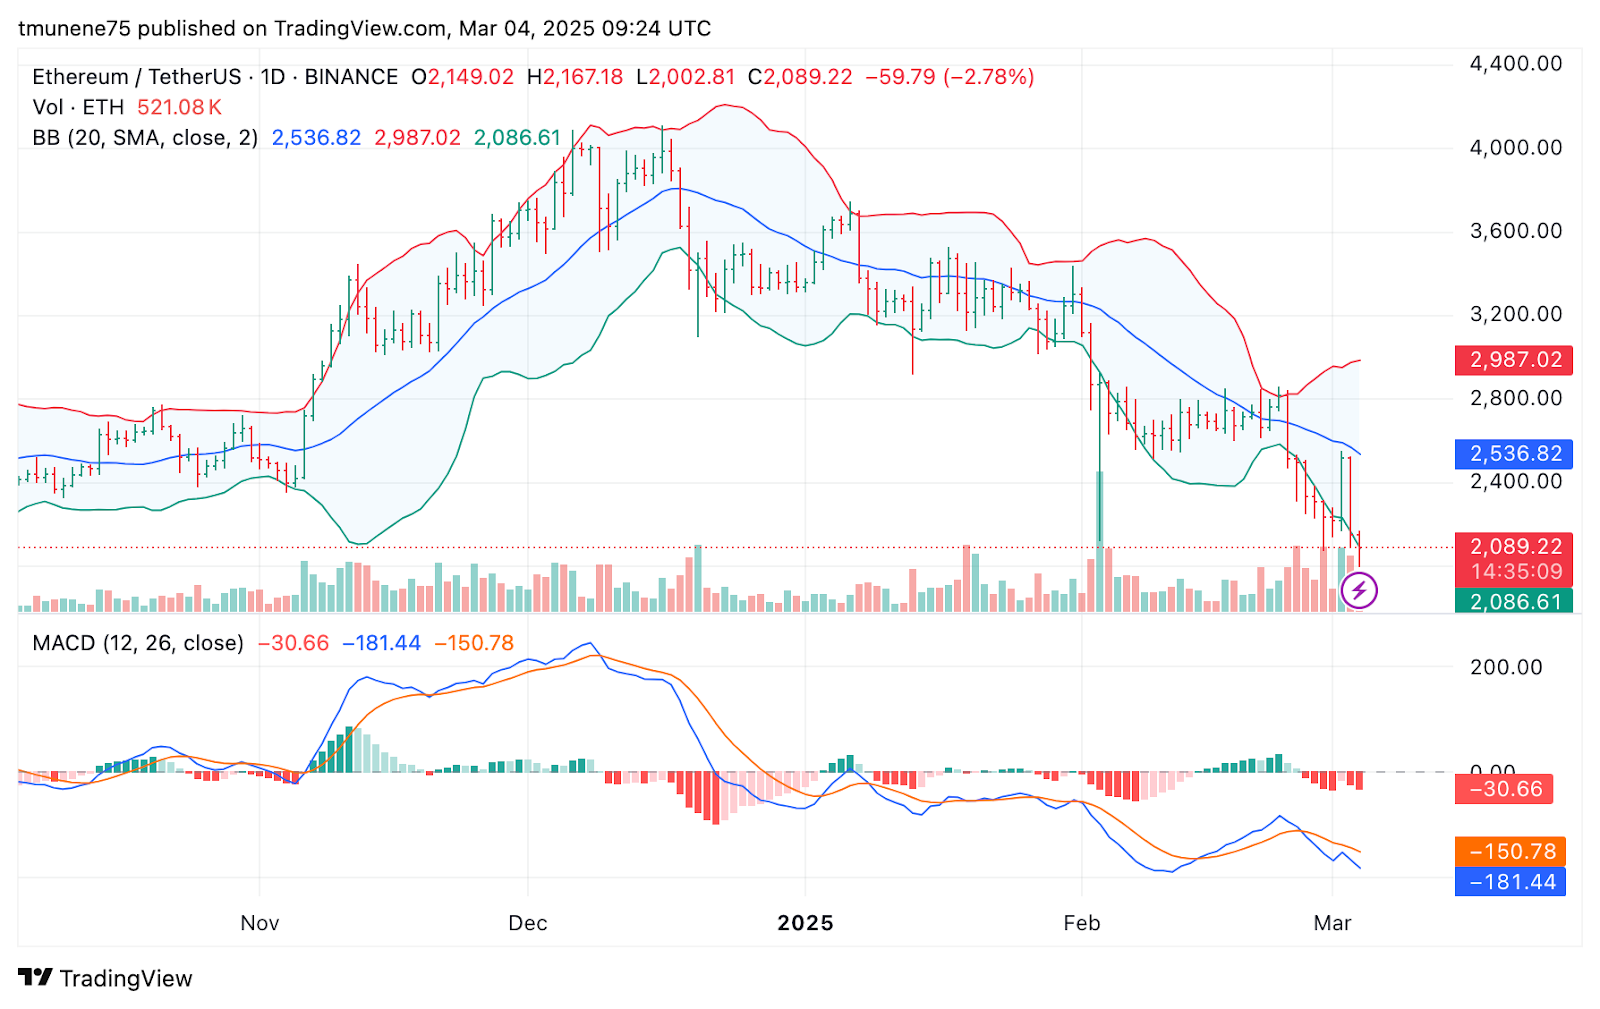
The simple moving average at $2,536.79 is significantly above the current price, indicating a prevailing downtrend. The upper Bollinger Band at $2,987.12 is a major resistance level. The MACD indicator also shows strong bearish momentum.
The MACD line is at -30.70, while the signal line is at -150.79, with a histogram reading of -181.49. As long as the MACD remains negative, downward pressure is likely to persist. Volume shows 521.1K ETH traded, suggesting moderate market activity. A lack of strong buying interest could further restrain any recovery attempts.
Potential Price Scenarios for March 5
If Ethereum holds above $2,000, bullish traders may push prices toward $2,200. A successful break above $2,250 could push ETH toward $2,400 and potentially the SMA 20 level at $2,536.79.
However, failure to hold $2,000 could lead to further downside. The next support is at $1,950, followed by $1,900. Extended bearish momentum may see ETH testing $1,750 or $1,500 in an extended sell off.
According to analyst Rose, Ethereum is below a support zone around $2,260. A break below $2,240 has pushed prices to the new lows. The market is volatile, with both bullish and bearish scenarios in play.
ETH Support Levels to Watch
ETH price pattern indicates lower highs and lower lows, confirming a downtrend. While a brief breakout pushed ETH above $2,300, the retracement to $2,000 suggests key support is being tested.
Long wicks on recent candles indicate buyer interest. If this support zone holds, Ethereum could see a reversal. However, failure to maintain this level may lead to further declines. Resistance levels include $2,320 – $2,360 as a short term target, followed by $2,480 – $2,520 for a potential breakout.
A push beyond $2,680 – $2,720 could indicate strong bullish momentum. Monitoring price levels is essential, as Ethereum’s next move depends on whether buyers can defend crucial support zones.


