Saturday, June 21, 2025
Daily Crypto Post
  • Home
  • News
    • Altcoins News
    • Cryptocurrency News
  • Market
    • Price Analysis
  • About
  • Contact
No Result
View All Result
  • Home
  • News
    • Altcoins News
    • Cryptocurrency News
  • Market
    • Price Analysis
  • About
  • Contact
No Result
View All Result
Daily Crypto Post
No Result
View All Result

Ethereum Drops Sharply as Whales Accumulate Over 600K ETH Key Levels to Watch

Irene Mukiri by Irene Mukiri
February 12, 2025
in Binance Feed, Market
Reading Time: 5 mins read
Ethereum Drops Sharply as Whales Accumulate Over 600K ETH—Key Levels to Watch
Share on FacebookShare on TwitterShare on RedditShare on Telegram
  • Whale purchases of 600K ETH signal growing confidence among large holders.
  • Over 1M ETH withdrawn from exchanges, reducing sell pressure and market volatility.
  • Ethereum’s RSI near oversold, suggesting potential short-term price bounce.

Ethereum’s price has experienced a sharp decline, accompanied by significant whale activity and exchange withdrawals. According to crypto analyst Ali Martinez, whales have purchased over 600,000 Ethereum (ETH) in the past week. This substantial accumulation suggests growing confidence among large holders. 

Whales have bought over 600,000 #Ethereum $ETH in the past week! pic.twitter.com/y736DxlGSP

— Ali (@ali_charts) February 12, 2025

Related articles

Can Ripple’s UK Strategy Spark a Breakout for $XRP

Can Ripple’s UK Strategy Spark a Breakout for $XRP?

June 20, 2025
Gold Weakens as Crypto Rises Market Shifts Hint at Bullish Risk-On Sentiment

Gold Weakens as Crypto Rises: Market Shifts Hint at Bullish Risk-On Sentiment

June 20, 2025

Moreover, Martinez reports that more than 1 million ETH have been withdrawn from exchanges within the same period. Such large-scale withdrawals typically indicate reduced sell pressure, as investors move assets to private wallets for long-term holding.

More than 1 million #Ethereum $ETH have been withdrawn from exchanges in the past week, signaling increased accumulation and reduced sell pressure, as shown by data from @santimentfeed! pic.twitter.com/1r5sZXmYFP

— Ali (@ali_charts) February 11, 2025

Ethereum’s Liquidation Data and Market Volatility

Besides whale activity, Ethereum’s liquidation data reveals high volatility in recent months. The ETH Total Liquidations Chart highlights significant liquidation events, particularly in early February. Liquidations exceeded $330.658 million during that period, primarily affecting long positions. 

Source: Coinglass

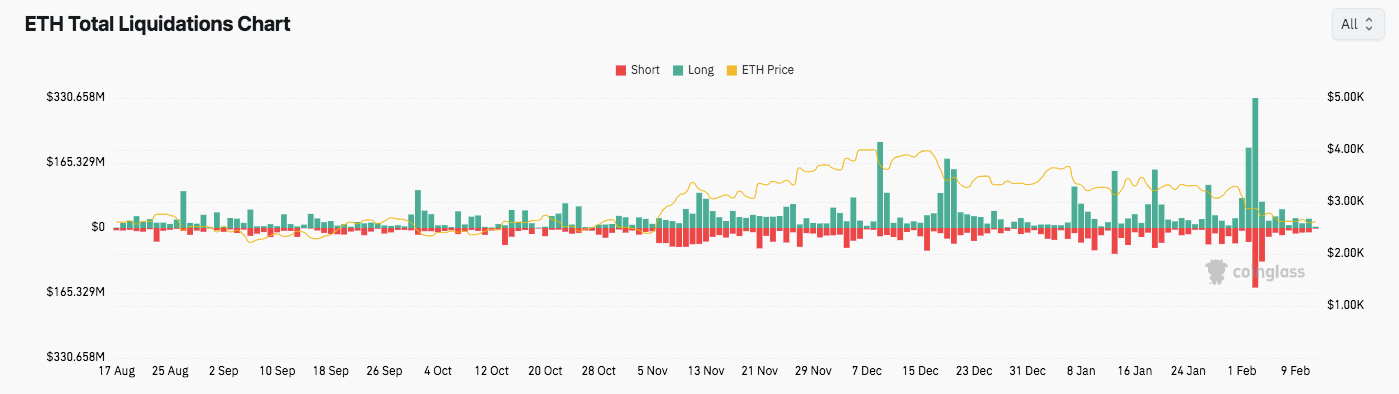
Throughout this timeframe, long liquidations outpaced short liquidations, especially during price surges. However, short liquidations were dominant in early November when Ethereum’s price climbed, forcing traders who had bet against the asset to exit their positions.

Ethereum’s Current Price Performance

Ethereum’s price has fluctuated significantly, recently trading at $2,623.96. Over the past 24 hours, it has declined by 3.10%, with a 5.01% decrease over the last seven days. With a circulating supply of 120 million ETH, the cryptocurrency’s market capitalization stands at $316.03 billion. Despite its current downtrend, key technical indicators suggest potential price movements in the coming days.

Key Support and Resistance Levels

The price trend shows that Ethereum is in a strong downtrend, with its latest closing price at $2,515.3, reflecting a 5.36% decline. A pattern of lower highs and lower lows suggests persistent downward momentum. Support levels include $2,500, which serves as a psychological threshold, and the $2,300-$2,400 range, where past consolidations indicate potential buyer interest. 

If selling pressure intensifies, Ethereum could test the $2,000 level, a historically significant support zone. Conversely, resistance levels lie between $2,630 and $2,650, where the price has struggled to recover. A stronger bullish reversal would need to breach $2,800 before facing the critical $3,000-$3,200 resistance zone.

Technical Indicators and Market Outlook

ETH/USD daily price chart, Source: Trading view

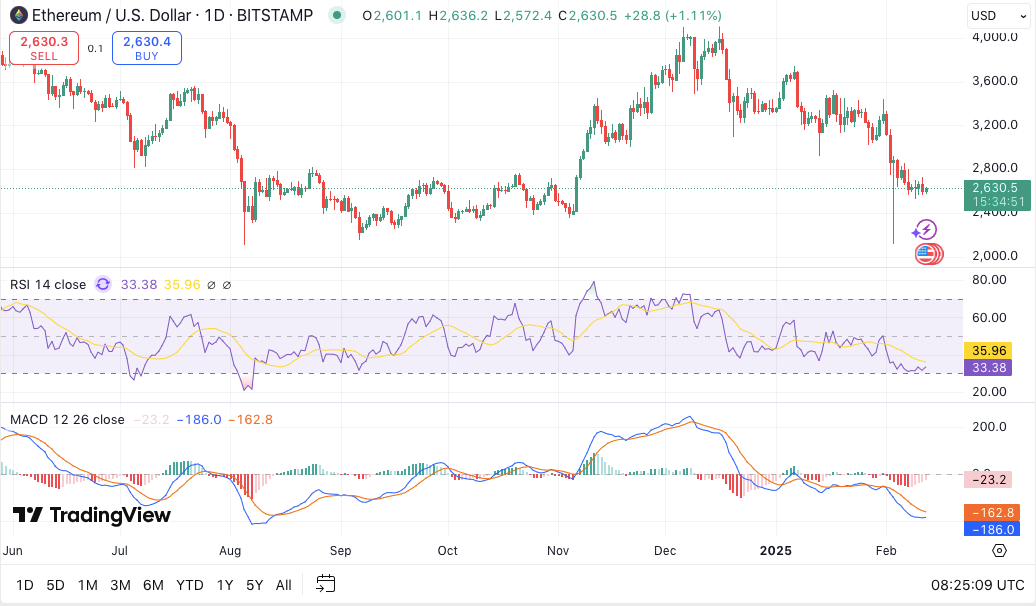
Technical indicators provide further insights into Ethereum’s market outlook. The Relative Strength Index (RSI) currently stands at 33.45, nearing oversold conditions. This suggests a possible short-term price bounce if buyers regain control. 

Additionally, the Moving Average Convergence Divergence (MACD) indicator shows a bearish crossover, with the MACD line positioned below the signal line. The histogram reflects strong negative momentum, reinforcing continued downward pressure.

Tags: Ethereum (ETH) NewsPrice Analysis

Related Posts

Can Ripple’s UK Strategy Spark a Breakout for $XRP

Can Ripple’s UK Strategy Spark a Breakout for $XRP?

by Munene Timothy
June 20, 2025

Ripple's UK framework calls for licensing clarity and partnerships to help the UK close the global crypto regulation gap. XRP...

Gold Weakens as Crypto Rises Market Shifts Hint at Bullish Risk-On Sentiment

Gold Weakens as Crypto Rises: Market Shifts Hint at Bullish Risk-On Sentiment

by Irene Mukiri
June 20, 2025

Gold struggles below key levels as traders rotate to bullish crypto and risk assets. Fed rate outlook and easing geopolitical...

XRP Price Prediction for June 21 2025 Whale Accumulation Hints at XRP Surge Toward $3

XRP Price Prediction for June 21 2025: Whale Accumulation Hints at XRP Surge Toward $3

by Jonathan Carls
June 20, 2025

XRP holds firm at $2.150 support, signaling strong accumulation and investor confidence Whale accumulation and $68.8M in realized profits hint...

Crypto Market Tops $3.42T as Bitcoin Rises, Altcoins Diverge, and Stablecoins Expand

Crypto Market Tops $3.42T as Bitcoin Rises, Altcoins Diverge, and Stablecoins Expand

by Veronicah Peninah
June 20, 2025

Total crypto market cap rose to $3.42T as Bitcoin and Ethereum posted moderate gains despite low macroeconomic triggers. GT, KAIA,...

Altcoin Market Faces $31M Supply Surge as Token Unlocks Threaten Liquidity Next Week

Altcoin Market Faces $31M Supply Surge as Token Unlocks Threaten Liquidity Next Week

by Munene Timothy
June 20, 2025

BLAST leads token unlocks with $25.15M (35.08% of supply) set to release on June 26, raising strong sell-side pressure fears....

Load More

Recent News

  • Can Ripple’s UK Strategy Spark a Breakout for $XRP?
  • Crypto Platform “PUMP FUN” To Be Banned In India the Coming Weeks
  • Gold Weakens as Crypto Rises: Market Shifts Hint at Bullish Risk-On Sentiment
  • XRP Price Prediction for June 21 2025: Whale Accumulation Hints at XRP Surge Toward $3
  • Crypto Market Tops $3.42T as Bitcoin Rises, Altcoins Diverge, and Stablecoins Expand

Popular News

  • JasmyCoin Sets Bold $17 Price Target by 2026 as User Adoption Surges

    JasmyCoin Sets Bold $17 Price Target by 2026 as User Adoption Surges

    226 shares
    Share 90 Tweet 57
  • Will SHIB’s Utility Tokens Fuel Its Rise Over TON?

    204 shares
    Share 82 Tweet 51
  • Aptos and Filecoin Lead the Next Layer 1 Push — Will They Sustain the Rally?

    195 shares
    Share 78 Tweet 49
  • Shiba Inu (SHIB) Price Prediction for May 18: Recovery Pause or Breakdown Ahead?

    195 shares
    Share 78 Tweet 49
  • SUI Holds Strong After $220 Million Cetus Exploit, Eyes New Highs with Rapid Expansion

    191 shares
    Share 76 Tweet 48

Live Crypto News | Bitcoin and Altcoins News & Insights.

Recent News

Can Ripple’s UK Strategy Spark a Breakout for $XRP
Can Ripple’s UK Strategy Spark a Breakout for $XRP?
June 20, 2025
CRYPTO PLATFORM PUMP FUN TO BE BANNED IN INDIA IN THE COMING WEEKS
Crypto Platform “PUMP FUN” To Be Banned In India the Coming Weeks
June 20, 2025
Gold Weakens as Crypto Rises Market Shifts Hint at Bullish Risk-On Sentiment
Gold Weakens as Crypto Rises: Market Shifts Hint at Bullish Risk-On Sentiment
June 20, 2025

© Daily Crypto Post. Live Crypto News | Bitcoin and Altcoins News & Insights. All Rights Reserved.

No Result
View All Result
  • Home
  • News
    • Altcoins News
    • Cryptocurrency News
  • Market
    • Price Analysis
  • About
  • Contact