
- Brett’s 8.39% price surge follows a 49% jump in trading volume, reflecting revived interest in Base Network memecoins.
- Technical indicators like MACD and RSI show bullish signals, with price breaking above 7-day SMA and EMA levels.
- Price now nears resistance at $0.13078 after rebounding from Bollinger Band mid-level, suggesting short-term momentum shift.
Brett (ETH) recorded an 8.39% price jump in the past 24 hours, trading at $0.1234 at press time. This gain comes as renewed momentum on the Base Network draws speculative interest across meme coins.
According to a trader post on X, investors may soon realize the long-term potential of Brett on Ethereum, similar to what unfolded with PEPE. That comment has raised curiosity, as Brett now gains attention for its recent technical breakout, rising trading activity, and market alignment with the broader altcoin rotation. The rise follows a daily surge in trading volume and technical developments that suggest momentum is building again.


Memecoin Flows Shift Toward Brett Amid Base Network Resurgence
The Base Network, built on Ethereum Layer 2, has seen an uptick in memecoin activity this week. Brett emerged as one of the top gainers, fueled by a 49% increase in daily trading volume to $1.35 million.
This coincided with a mild dip in Bitcoin dominance to 64.46%, while the Altseason Index jumped by 17.39% over the week. That shift indicates increased capital movement into smaller assets like Brett. Traders now appear to rotate into altcoins, with Brett capturing notable attention due to its position within Base’s growing ecosystem.
Technical Indicators Suggest Upside Momentum Could Continue
Brett’s price recently broke above both the 7-day SMA at $0.1198 and the 7-day EMA at $0.1165, pointing to positive short-term momentum. The MACD histogram turned positive for the first time in a week, now showing a divergence of 0.00774.
Furthermore, the MACD line crossed above the signal line, often viewed as a bullish development. Meanwhile, RSI-7 is at 44.49, still well below the overbought level. These indicators collectively point to a trend shift, though the market remains cautious due to Brett’s 60-day decline of 25%.
Price Movement Approaches Key Resistance
Since late June, Brett traded near the lower Bollinger Band but has now surged above the mid-band of $0.11067. That move led to a daily high of $0.12611, bringing the price closer to the upper Bollinger Band at $0.13078.
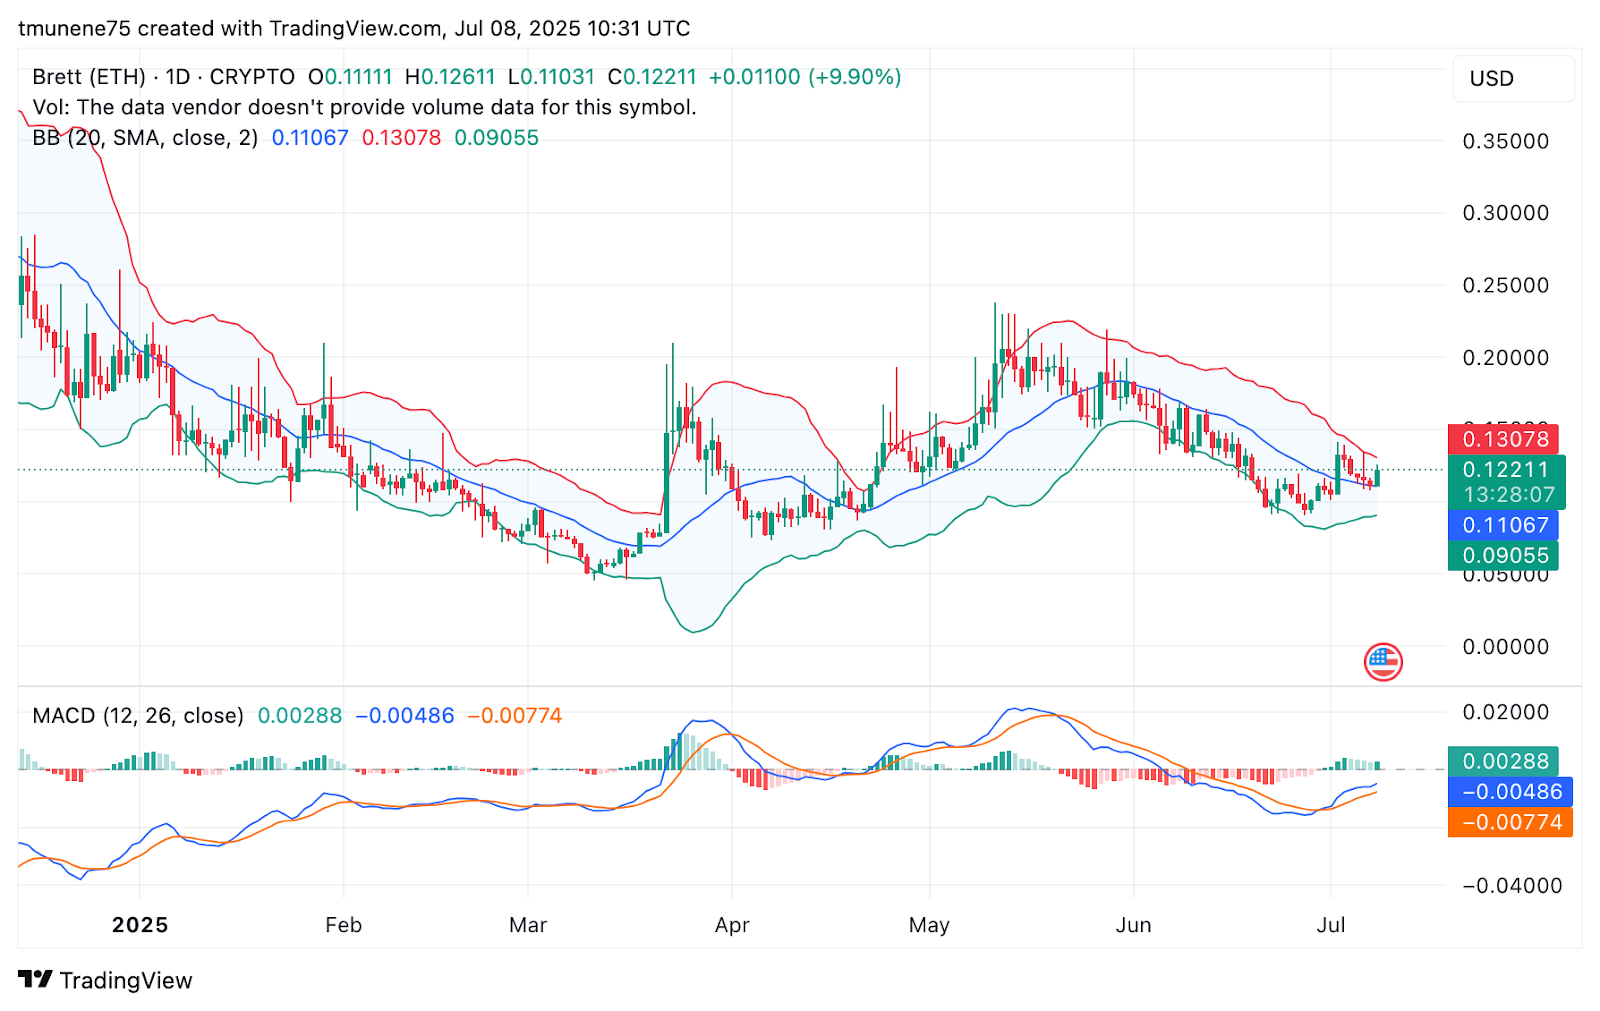
Price action also shows a similar pattern seen in March and April, when rallies briefly extended beyond $0.25 before reversing. However, current momentum differs in volume strength, which now supports the breakout but still lacks confirmation for sustained continuation.
Brett’s current move is backed by both sector flows and technical confirmation. With trading volume rising and key levels breached, the price now tests resistance between $0.130 and $0.135. Yet, the market also remains alert for a fallback toward the $0.11067 or $0.09055 support zones, especially if buying pressure slows.


