
- DEEP shows consolidation signs as price holds firm between $0.12 and $0.14 range
- MACD points to bullish momentum while RSI hints at possible short-term pullback
- Surge in trading volume signals rising speculative interest and market participation
DeepBook Protocol ($DEEP) experienced a dramatic surge in its price on April 22, capturing the attention of traders and investors. After moving sideways near $0.095 for much of the day, the token unexpectedly surged to a high of $0.18. Although the spike was short-lived, it indicated significant speculative activity and growing market interest.
Following the surge, the price retraced but stabilized in the $0.12–$0.14 zone, suggesting early signs of consolidation. As traders now look ahead to April 23, $DEEP’s short-term outlook depends heavily on volume, momentum indicators, and key support-resistance dynamics.


Support and Resistance Levels Point to a Tense Battle
Currently, $DEEP holds above the soft support at $0.12, which emerged after the post-spike retracement. This level has now become a crucial floor in the near term. If bearish pressure intensifies, a retest of the stronger support at $0.095 could follow. That level acted as a launchpad for the recent rally, and many traders now see it as a potential accumulation zone.
On the upside, $0.14 stands as immediate resistance. The token has tested this level multiple times but hasn’t closed convincingly above it. The more significant resistance lies at $0.18 the peak of the spike. Breaking this level will likely require strong buying volume and fresh market catalysts. Without such support, attempts to push higher could quickly fade.
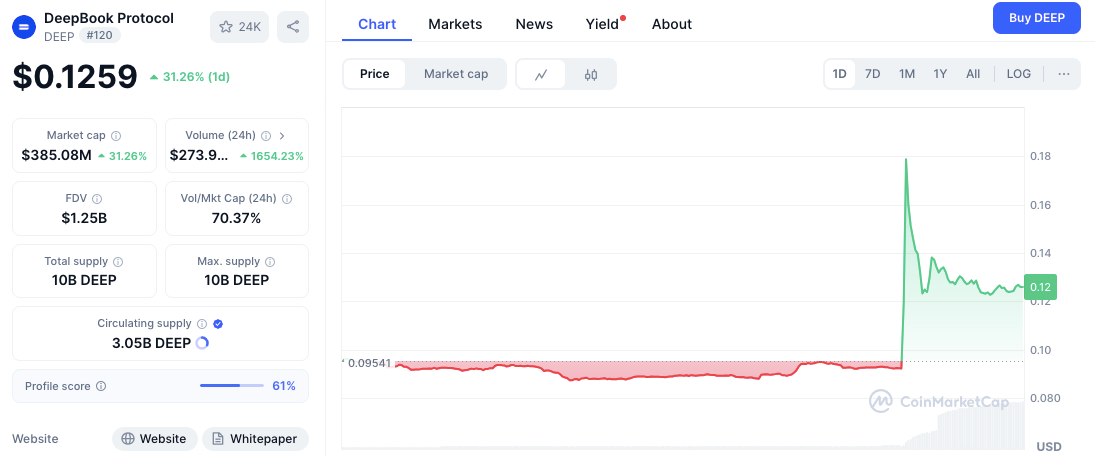
Significantly, the trading volume surged over 1600%, pointing to speculative interest or possible news-driven activity. Meanwhile, the market cap increased by 30%, showing that some level of investor confidence remains beyond just a flash pump.
Technical Indicators Flash Mixed Signals
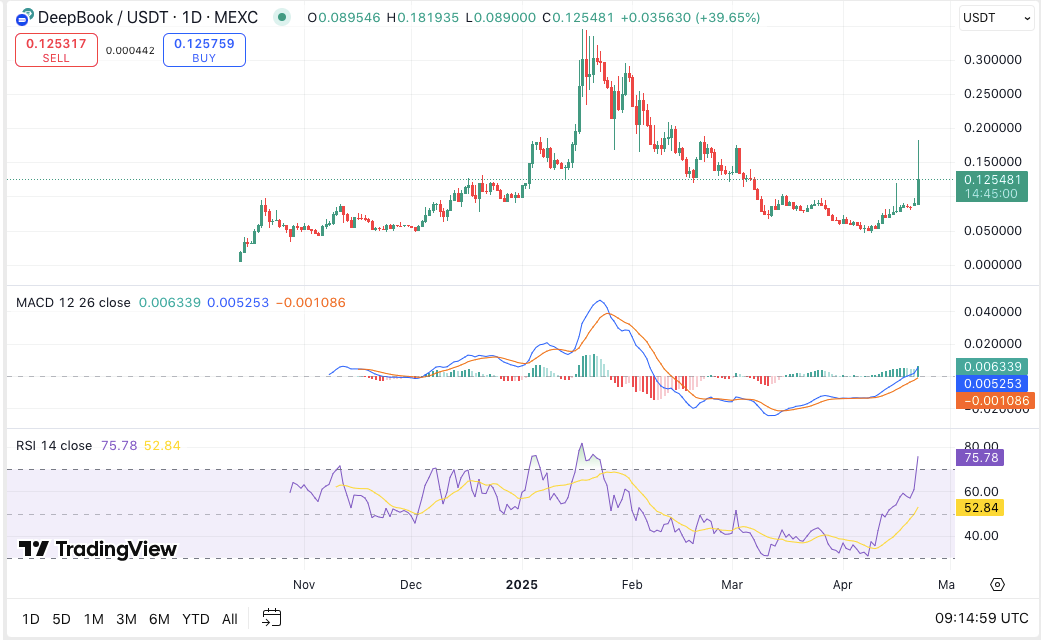
The MACD (Moving Average Convergence Divergence) shows bullish momentum. The MACD line remains above the signal line, and both sit in positive territory.
Moreover, the histogram continues to rise, indicating growing buying pressure. This reinforces the view that buyers still have some control over the short-term trend.
However, the RSI (Relative Strength Index) tells a different story. Currently at 75.61, the RSI is firmly in overbought territory. This suggests the token may be due for a pullback or further sideways action before attempting another breakout.


