
- CRO faces strong resistance at $0.10 after a 15.61% surge and sharp pullback.
- Momentum weakens as RSI falls and MACD turns negative, signaling trend reversal.
- Long liquidation spike suggests rising volatility and overly bullish trader sentiment.
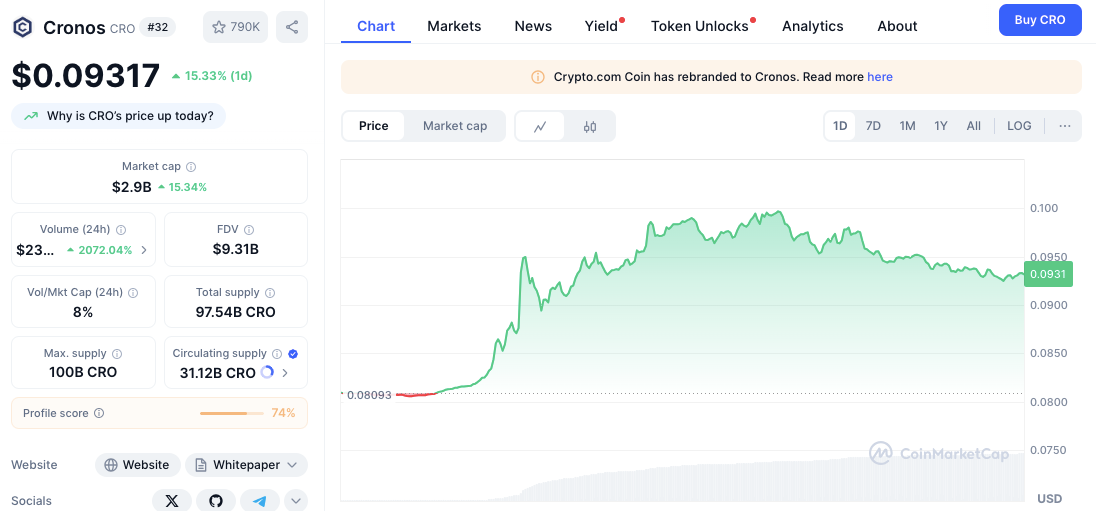
Cronos (CRO) experienced a volatile price swing early on July 9, 2025, capturing the attention of crypto traders. The token surged from its opening level near $0.0809 to a peak just above $0.10.
This sharp upward move marked a 15.61% daily gain before retreating to hover around $0.0926. Despite this strong performance, weakening momentum indicators and high liquidation activity suggest CRO may be approaching a turning point.


Significantly, the spike in trading volume nearly 20 times the daily average points to intense speculative interest. However, as prices flirt with key resistance zones, traders must tread cautiously. With the $0.10 psychological mark proving hard to breach, CRO now stands at a technical crossroads.
Key Support and Resistance Levels in Play
CRO’s recent rally pushed the price into a tight consolidation band between $0.093 and $0.094. This range now acts as a temporary buffer. Immediate support lies at $0.0900, a level that held firm after the pullback. Below this, $0.0850 and $0.0800 serve as crucial support levels, established during past consolidation periods.
On the resistance side, $0.0950 has emerged as a minor ceiling. It repeatedly halted upward momentum throughout the last 24 hours. Above that, the $0.0975–$0.0985 zone presents a significant challenge, with multiple price rejections observed there.
The most critical barrier remains $0.10. Failure to sustain movement above this level could invite bearish pressure and drag the token down toward previous lows.
Momentum Indicators and Liquidation Signals
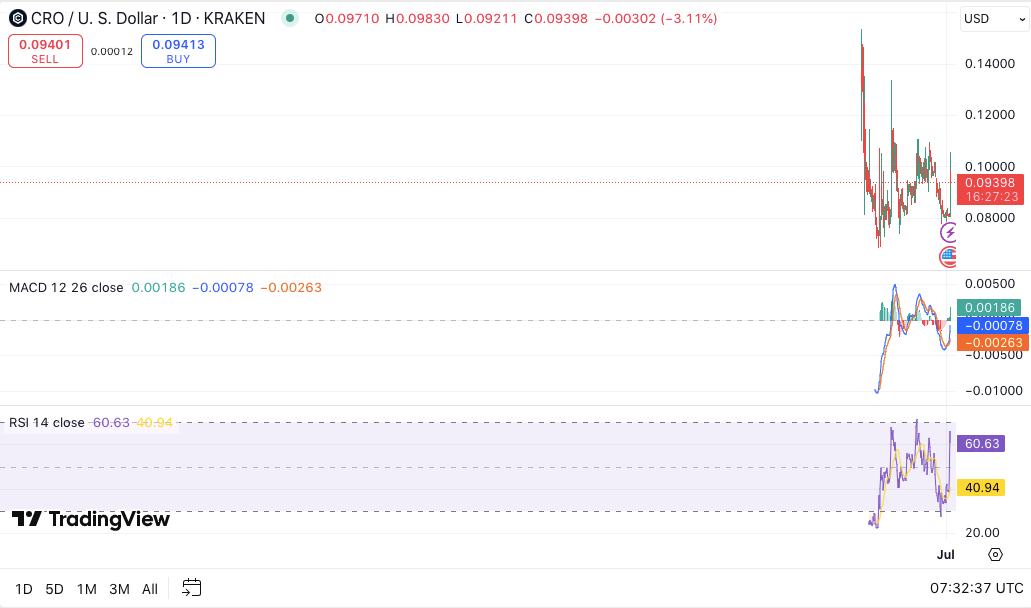
Despite the price rise, technical indicators suggest fading momentum. The RSI recently dropped from 59.80 to just above 40, indicating a weakening bullish trend. A dip below 40 could hint at increasing downside momentum.
The MACD histogram has also turned negative, implying a potential bearish crossover. This shift could lead to short-term price weakness unless buying pressure rebounds quickly.
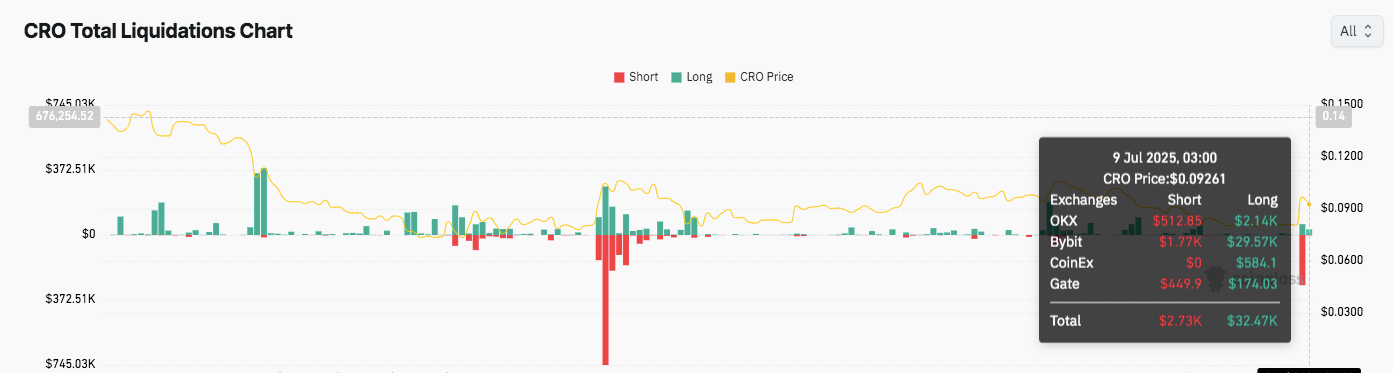
Furthermore, liquidation data reveals more long positions being wiped out than shorts. Bybit alone accounted for $29.57K in long liquidations, hinting that traders may have been overly optimistic. The imbalance highlights market fragility and points to rising volatility.


