- The launch of Reeve has attracted corporate attention by enabling ERP-integrated and strengthening Cardano’s real-world use cases beyond DeFi.
- ADA surged 13.8%, broke above $0.7191 resistance and the 200-day MA, supported by rising volume and strong technical indicators like RSI and MACD.
- Cardano’s bounce between the 0.618–0.786 Fibonacci levels suggests a potential market bottom and sets the stage for a mid-term bullish trend if resistance levels are broken.
The launch of Reeve has drawn interest from corporate finance sectors in need of secure and transparent audit trails. By connecting with ERP systems, Reeve allows enterprises to record immutable financial data—a use case blockchains have rarely addressed. This program is in line with recent market confidence in ADA, indicating increasing confidence in the growing use of the Cardano blockchain outside of decentralized finance.
At the time of writing, the native token of Cardano, ADA, displayed a significant short-term breakout, increasing by 13.8% to the $0.7187 level. This growth saw prices breaking through the recent resistance point of $0.7191.


ADA Breaks Above MA200 as Bulls Target Short-Term Upside
The price of Cardano has been able to break out over its 200-day moving average (MA200), which contributes to the current bullish mood. The main support level is at $0.6233, which has held firm in the recent price corrections. The hourly RSI shows, however, that the market can undergo short-term corrections due to being overbought. Despite that, the trading volume has expanded, signaling confirmation of market interest rising.
Traders are closely watching for a sustained hold above the $0.7191 resistance level. Should ADA maintain this position, the short-term technical structure remains favorable. Furthermore, the breakout aligns with broader bullish market sentiment in the cryptocurrency sector.
Technical Indicators Signal Strong Bullish Momentum
On the hourly chart, the Relative Strength Index (RSI) stands at 78.47, well above the overbought threshold of 70. Notably, this high RSI reading suggests strong recent buying momentum.
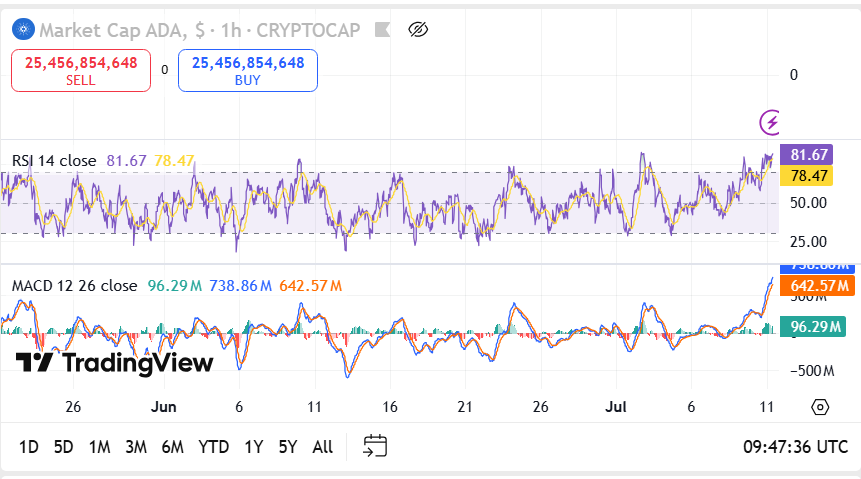
Moreover, the Moving Average Convergence Divergence (MACD) indicator displays a positive projection of purchasing power, and the histogram records a buying pressure of 100.18 million and 643.54 million. The histogram bars continue to stay on the positive side strengthening the bullishness and hinting of continued upward solidity.
Cardano Fibonacci retracement Signal Bullish Reversal
As noted by analyst theMoonHailey, Cardano (ADA/USDT) signifies the potential for a bullish reversal following a recovery from a key Fibonacci retracement level. Price reversed between the 0.618 and 0.786 levels, which at times are identified as a vital support zone during the period of correction.
This rebound suggests the recent correction has likely reached its bottom, opening the way for new strength. Traders are now on the lookout for verification in the form of rising volume and a break into near-term levels of resistance. The mid-term outlook is contingent upon whether ADA is able to sustain this rebound and continue to add to its gains.


