
- ADA must break above $0.67 to confirm a trend reversal and unlock bullish targets.
- RSI and MACD show weak momentum, keeping Cardano under short-term bearish pressure.
- Elliott Wave signals smart money accumulation, with a long-term target up to $8.00.
Cardano (ADA) is at a critical juncture, with market analysts divided over its next major move. After months of steady accumulation and volatile swings, the price of ADA is struggling within a descending channel.
At press time, Cardano trades near $0.5868, reflecting a daily decline of over 3%. Despite this pullback, several technical indicators and expert opinions suggest the cryptocurrency might be gearing up for a strong rally if key levels are breached. However, until the market sees confirmation, Cardano remains under bearish technical pressure.


Daily Close Above $0.67 Could Change the Game
Ali Martinez, a market analyst, highlights $0.67 as a key level for Cardano bulls. A daily close above this mark could invalidate the current downtrend and trigger a rally toward the $0.83 to $0.91 range.
A daily close above $0.67 could set Cardano $ADA on course for a rally to the $0.83–$0.91 range! pic.twitter.com/r5oS6ZKkyA
— Ali (@ali_charts) July 3, 2025
Moreover, the $0.6727 Fibonacci retracement level and the midline resistance of the descending channel both align near this zone, making it a critical battleground. Besides, a breakout here would also push ADA above the 0.786 Fib level, indicating strong bullish momentum. For now, price remains constrained between support at $0.52 and resistance around $0.67.
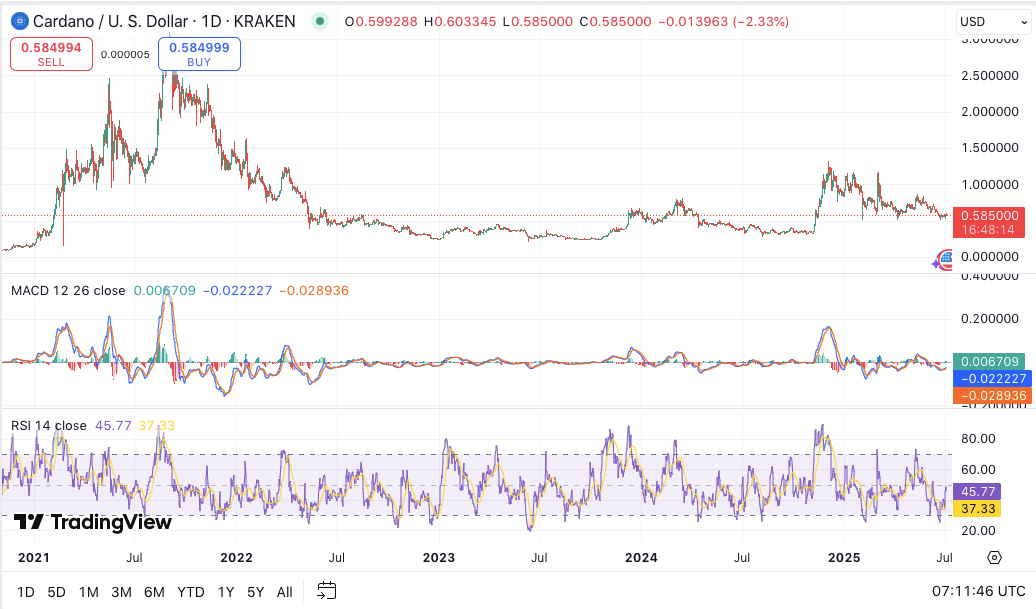
Technical indicators are still neutral to bearish. The MACD recently showed weakening bullish momentum, and the RSI hovers around 46, suggesting indecision. Although the RSI dipped below 40 during recent corrections, it failed to enter oversold territory, leaving room for further downside unless buyers step in.
Long-Term Elliott Wave Structure Signals Accumulation
Meanwhile, XForceGlobal, another market analyst, offers a broader perspective. He notes that Cardano has been forming higher lows on the medium timeframes, a sign of smart money accumulation.
According to his Elliott Wave analysis, ADA is likely in a complex corrective phase, specifically a WXY structure within Wave (2). Importantly, the analyst identifies a strong support zone between $0.22 and $0.25 as the possible cycle bottom.
Consequently, if the current correction completes as expected, ADA could enter a powerful Wave (3) impulse. This could potentially drive prices toward $1.15 initially, then $2.70, and possibly even $8.00 in the long term.


