
- Bitcoin’s RSI at 59.88 shows neutral to slight bullish momentum; staying above 50 could maintain the uptrend.
- A drop below $79,270 support may push BTC toward $69,450; breaking this level could expose $50,000–$60,000 downside risks.
- BTC’s 50-week EMA and trendline are key supports; holding above them could lead to a bullish rally, while breaking below signals correction.
Bitcoin’s price is at a crucial point as two key support levels could define its near-term movement. On-chain data from IntoTheBlock shows support at $79,270 and $69,450, leading to speculation on whether these levels can hold or if further declines are imminent.
On-chain data from @intotheblock highlights two key support levels for #Bitcoin $BTC: $79,270 and $69,450. pic.twitter.com/gYlqMgbJce
— Ali (@ali_charts) March 12, 2025
RSI Trends Show Potential for Volatility
Egrag Crypto weighed in on Bitcoin’s price movement, stating,


The market will inflict pain, but not through a drop to lower levels. Instead, a sharp rally to much higher prices will leave many behind.
This suggests that volatility may persist, but an unexpected upward move remains possible. The RSI is at 59.88, indicating neutral to slightly bullish sentiment.
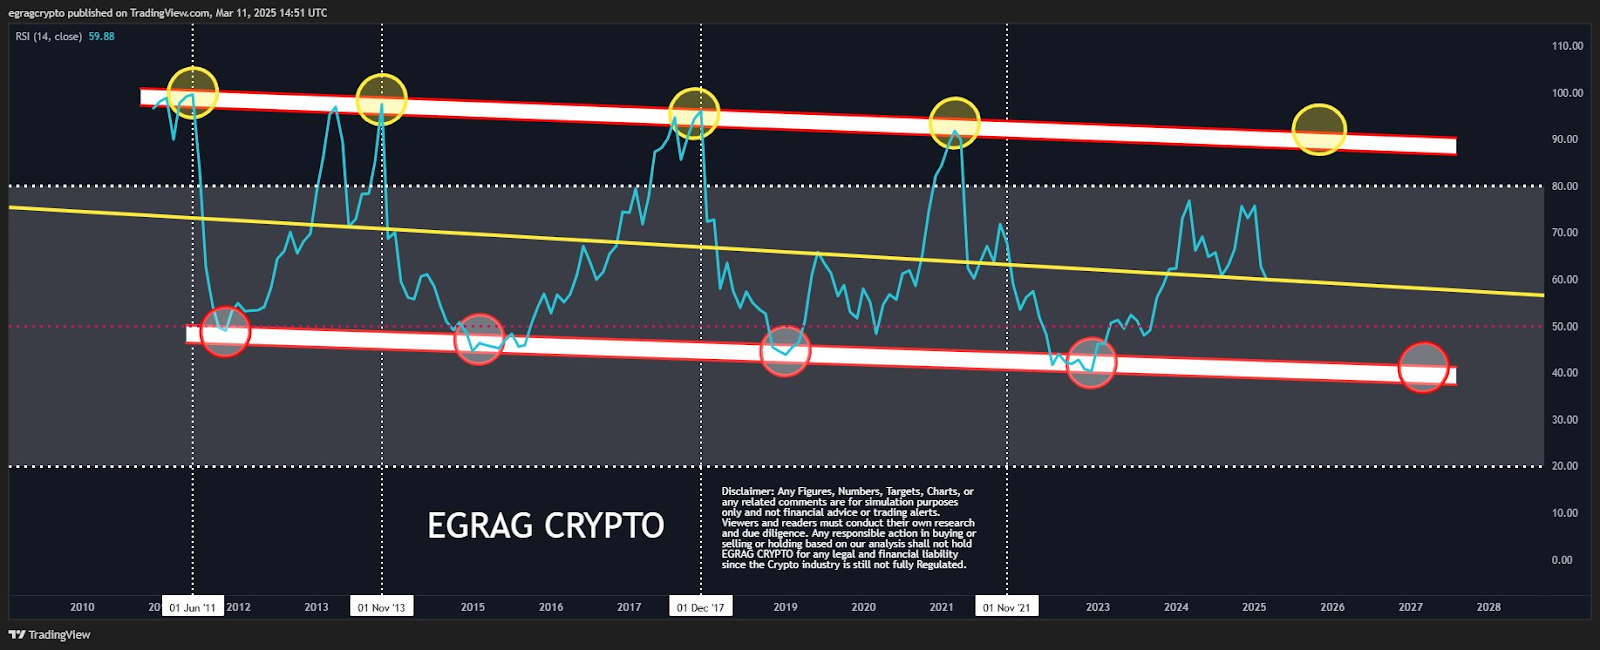
Historical trends show that RSI peaks near 90 have marked market tops in past cycles, while dips to 40 or below have indicated bear market bottoms. The most recent test of the 40 RSI level occurred in 2023, aligning with previous correction phases. If Bitcoin maintains an RSI above 50, bullish momentum could persist. However, a drop below 40 may indicate extended losses.
The lower support at 69,450 is crucial, with a potential breakdown exposing Bitcoin to further declines toward $50,000–$60,000. RSI trends and key price levels suggest a delicate balance between bullish continuation and downside risk.
Bitcoin’s 50-Week EMA and Trendline Support
According to CryptoBullet, the 50 week Exponential Moving Average and a long-term trendline have been important in Bitcoin’s market outlook.
#BTC $BTC 1W chart
— CryptoBullet (@CryptoBullet1) March 11, 2025
This is the Support that can save us (at least for now) -> the intersection of the 50-Week EMA & 1.5-year trend line pic.twitter.com/hDX59noQey
The current price shows Bitcoin recently rebounded from this trendline, aligning with historical support tests in September and October 2023. Despite this bounce, Bitcoin’s price is near key support. A decisive hold above the trendline and EMA50 could indicate an uptrend, with potential for a new all-time high.
However, a break below the trendline may lead to deeper corrections, with possible downside targets between $72,000 and $75,000, or even as low as $64,500 if bearish momentum intensifies.
Market Sentiment and Potential Scenarios
Bitcoin’s price movement has led to mixed sentiment, with analysts offering contrasting views on the next move. Egrag Crypto suggests the market may bring unexpected moves, not through a drop to lower levels, but through a surge to higher ones.
If Bitcoin sustains its current levels and RSI remains above 50, bullish continuation remains possible. However, critical price zones must hold to maintain positive momentum. Losing the $79,270 support could shift sentiment toward a more bearish outlook, making the $69,450 level the next major test.


