Tuesday, July 1, 2025
Daily Crypto Post
  • Home
  • News
    • Altcoins News
    • Cryptocurrency News
  • Market
    • Price Analysis
  • About
  • Contact
No Result
View All Result
  • Home
  • News
    • Altcoins News
    • Cryptocurrency News
  • Market
    • Price Analysis
  • About
  • Contact
No Result
View All Result
Daily Crypto Post
No Result
View All Result

Can Bitcoin Break Above $120K or a Drop Below $73K? Analysts Weigh In on the Next Move

Munene Timothy by Munene Timothy
March 4, 2025
in Binance Feed, Market
Reading Time: 5 mins read
Can Bitcoin Break Above $120K or a Drop Below $73K Analysts Weigh In on the Next Move
Share on FacebookShare on TwitterShare on RedditShare on Telegram
  • BTC’s RSI at 36.64 nears oversold, but bearish momentum persists; a break above 40 to 45 may indicate recovery.
  • The MACD is negative, but a signal line crossover hints at a potential reversal if buying pressure increases.
  • Failure to hold $82K support could lead BTC toward $75K-$73K, while a breakout above $88K may push prices to $120K.

Bitcoin’s price movement has seen mixed projections from analysts, with some seeing a potential rally while others warn of a deeper drop. At the time of writing BTC was trading at $84,029.41, a 9.06% decline in the past 24 hours. The trading range for the day extends from $82,472.07 to $86,773.12, as bearish momentum builds following a retreat from highs above $100,000.

Support and Resistance Levels

Analyst Egrag Crypto notes the formation of a bearish engulfing candle on the three day timeframe. 

Related articles

SEI Gains Momentum as Wyoming Stablecoin Bid Lifts Market Interest

SEI Gains Momentum as Wyoming Stablecoin Bid Lifts Market Interest

June 30, 2025
Liquidity Concentration on CEXes Highlights Maturity and Gaps in Top Crypto Assets

Liquidity Concentration on CEXes Highlights Maturity and Gaps in Top Crypto Assets

June 30, 2025

#BTC : $73K by April 1st Before the Final Leg Up!
I sometimes take risks with time predictions ⏳, but I believe it's worth sharing, even if it could backfire!

Currently, #BTC is forming a potential Bearish Engulfing Candle on the 3-day time frame. This could trigger further… pic.twitter.com/fAXT3Zi65c

— EGRAG CRYPTO (@egragcrypto) March 4, 2025

This pattern suggests further downside risks, potentially pushing BTC toward $80,500 and even $73,000 by early April. The blue channel on the chart is crucial in assessing the strength and longevity of the ongoing trend.

According to Captain Faibik, Bitcoin is still trading within a rising wedge pattern on the weekly timeframe. The 50 week moving average at $75,700 is a critical support level. 

$BTC is still trading within Rising Wedge on the Weekly Timeframe.. 📈

Weekly MA50 (75.7k) is acting as a key support level.

– A bounce from MA50 could push Bitcoin toward $120K in the coming weeks.

– However, if MA50 Support fails and the Wedge breaks down, Bitcoin may… pic.twitter.com/e8scfIDEmD

— Captain Faibik 🐺 (@CryptoFaibik) March 4, 2025

A successful rebound from this level could push BTC toward $120,000 in the coming weeks. However, a breakdown below this level might lead to a retest of the $54,000–$55,000 zone, raising concerns about a deeper correction.

Historical Trends Suggest Possible Further Declines

Ali points out that Bitcoin has historically followed a recurring pattern after reaching all time highs. 

Before you FOMO, consider this! pic.twitter.com/49vqTTbuKx

— Ali (@ali_charts) March 3, 2025

In previous cycles; 2011, 2014, 2018, and 2021; BTC dropped to the 200 day moving average, rebounded to the 50 day moving average, faced rejection, and then declined further. 

The same pattern appears to be developing now, as BTC has bounced from the 200 day moving average and is struggling around the 50 day mark. If history repeats, further downside could be imminent.

Technical Indicators Indicate Continued Caution

Bitcoin’s technical indicators also lean toward a bearish outlook. The RSI is at 36.64, approaching oversold levels but still above the 30 level. A recovery above 40 to 45 could indicate strengthening bullish momentum. 

Source: TradingView

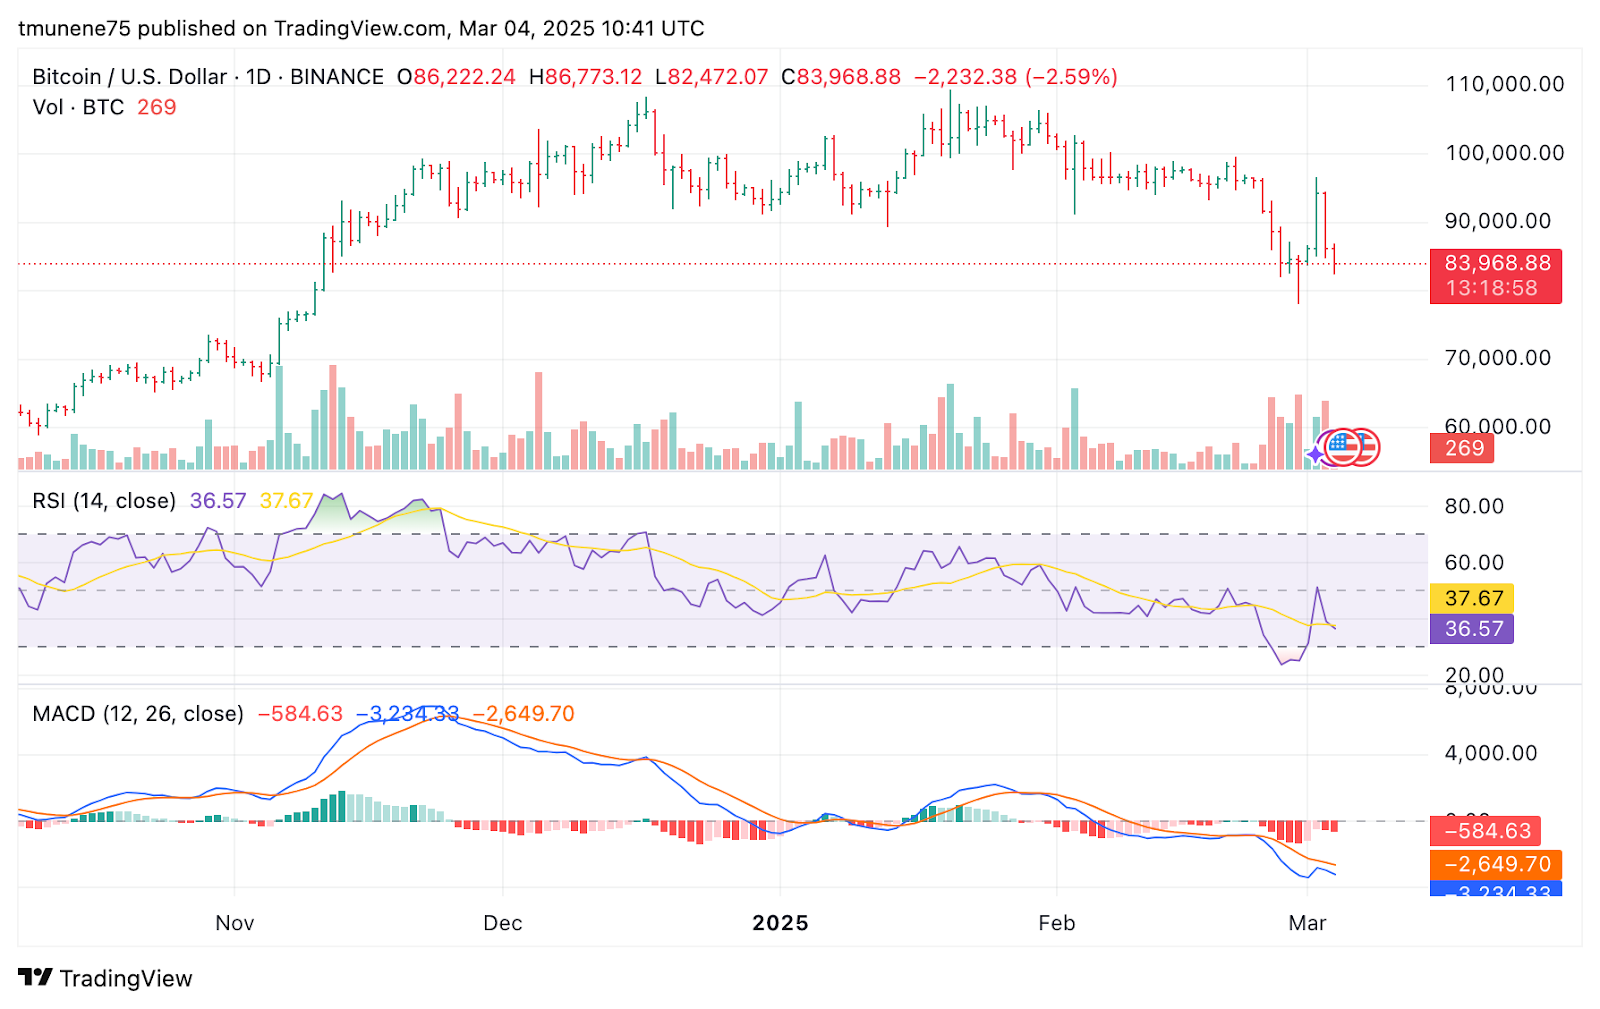
Meanwhile, the MACD is in a deep negative level, with the histogram confirming bearish momentum. However, the MACD line crossing above the signal line could suggest early signs of a potential reversal.

A break above $86,000 to $88,000 with increased volume could shift sentiment toward a bullish recovery. On the downside, failure to hold support between $82,000 and $80,000 might expose BTC to deeper losses, potentially testing the $78,000 to $75,000 range. 

Tags: Bitcoin (BTC) NewsPrice Analysis

Related Posts

SEI Gains Momentum as Wyoming Stablecoin Bid Lifts Market Interest

SEI Gains Momentum as Wyoming Stablecoin Bid Lifts Market Interest

by Munene Timothy
June 30, 2025

SEI surged by 50% in a week after Wyoming shortlisted it for its WYST stablecoin, boosting investor sentiment and public...

Liquidity Concentration on CEXes Highlights Maturity and Gaps in Top Crypto Assets

Liquidity Concentration on CEXes Highlights Maturity and Gaps in Top Crypto Assets

by Irene Mukiri
June 30, 2025

XRP liquidity is concentrated on Bitget, Binance, and Coinbase, totaling 67% depth. Solana surpasses XRP in liquidity strength despite its...

ETH Holds Ground After Liquidity Sweep, Resistance Retest Signals Potential Move to $3,400

ETH Holds Ground After Liquidity Sweep, Resistance Retest Signals Potential Move to $3,400

by Veronicah Peninah
June 30, 2025

Ethereum holds support at $2,425.62 after a key liquidity sweep near $2,300, indicating buyer interest. Multiple rejections at $2,700–$2,800 show...

Helius CEO Admits XRP Has Outshined Solana, Cites Technological Gap

Helius CEO Admits XRP Has Outshined Solana, Cites Technological Gap

by Jonathan Carls
June 30, 2025

XRP outperforms Solana in 2025, gaining 360% and surpassing SOL in market ranking. Mert Mumtaz’s comments signal a possible shift...

Is PEPE Leading the Meme Coin Revival Analyst Sees Jackpot July

Is PEPE Leading the Meme Coin Revival? Analyst Sees “Jackpot July”

by Munene Timothy
June 30, 2025

PEPE broke out of a falling wedge pattern with rising volume, indicating a potential bullish trend reversal. RSI at 45.39...

Load More

Recent News

  • SEI Gains Momentum as Wyoming Stablecoin Bid Lifts Market Interest
  • Liquidity Concentration on CEXes Highlights Maturity and Gaps in Top Crypto Assets
  • ETH Holds Ground After Liquidity Sweep, Resistance Retest Signals Potential Move to $3,400
  • Helius CEO Admits XRP Has Outshined Solana, Cites Technological Gap
  • Is PEPE Leading the Meme Coin Revival? Analyst Sees “Jackpot July”

Popular News

  • JasmyCoin Sets Bold $17 Price Target by 2026 as User Adoption Surges

    JasmyCoin Sets Bold $17 Price Target by 2026 as User Adoption Surges

    226 shares
    Share 90 Tweet 57
  • Will SHIB’s Utility Tokens Fuel Its Rise Over TON?

    204 shares
    Share 82 Tweet 51
  • Solana: SOL Has Just Reclaimed $7 Billion in DeFi TVL

    231 shares
    Share 92 Tweet 58
  • Over $33M in Token Unlocks Set to Impact Crypto Markets Amid Escalating Global Tensions

    199 shares
    Share 80 Tweet 50
  • Aptos and Filecoin Lead the Next Layer 1 Push — Will They Sustain the Rally?

    195 shares
    Share 78 Tweet 49

Live Crypto News | Bitcoin and Altcoins News & Insights.

Recent News

SEI Gains Momentum as Wyoming Stablecoin Bid Lifts Market Interest
June 30, 2025
Liquidity Concentration on CEXes Highlights Maturity and Gaps in Top Crypto Assets
June 30, 2025
ETH Holds Ground After Liquidity Sweep, Resistance Retest Signals Potential Move to $3,400
June 30, 2025

© Daily Crypto Post. Live Crypto News | Bitcoin and Altcoins News & Insights. All Rights Reserved.

No Result
View All Result
  • Home
  • News
    • Altcoins News
    • Cryptocurrency News
  • Market
    • Price Analysis
  • About
  • Contact