
- The recent BONK burst above a descending long-term trendline signifies a significant change in market sentiment that will likely catalyse a massive multi-month rally off June lows.
- The volume remained high, the RSI and MACD indicators were bullish and prices were trading consistently above support indicating an ongoing bullish move.
- BONK faces strong resistance at $0.00003161. A close above this level could open the path toward the measured move target of $0.00005000.
BONK has gained momentum as institutional interest grows, fueled by a targeted burn initiative and an expanding holder base. Market activity has intensified, signaling renewed traction around the meme-based token. In the latest session, BONK traded at $0.00003133, marking a 7.3% gain over the past 24 hours.
BONK Extends Rally After Breakout from Long-Term Downtrend
Data from ZAYKCharts shows that BONK has surged over 125% from its June low, marking a significant upward trend in recent weeks. The token broke over a long-term falling trendline on the daily chart, a level it had been respecting since around late 2023. This break follows months of consolidation, signaling a definitive shift in market sentiment.


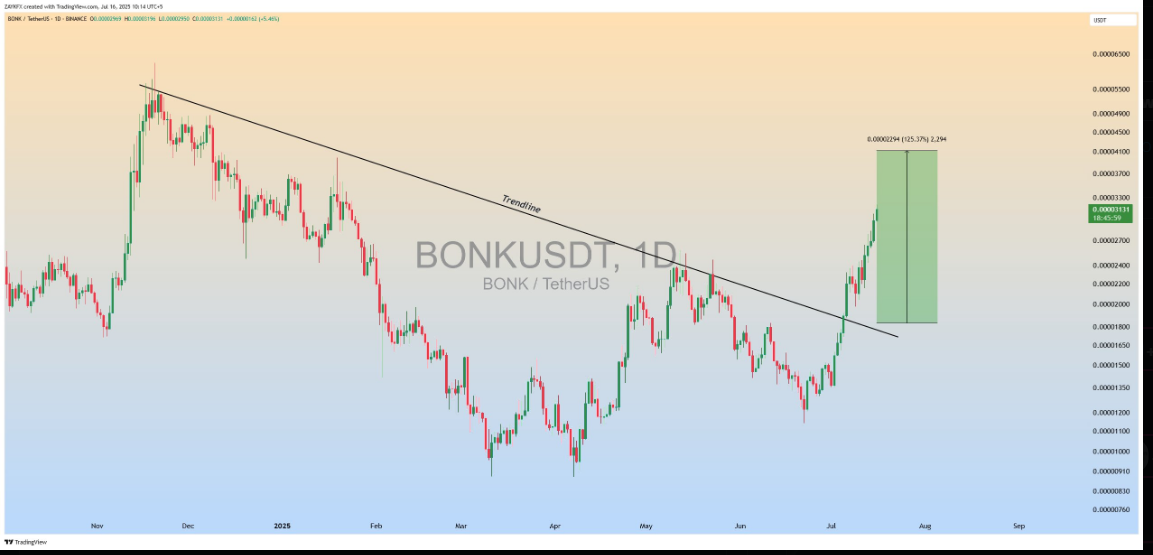
The above trendline breakout was also followed by strong green candles on increasing volume, enhancing the uptrend momentum. The chart also plots a measured move target of up to $0.00005000, which exists as long as the breakout remains above the retest zone around $0.00002200. The price currently fluctuates close to resistance at $0.00003161, with support established at $0.00002789.
This projection appears to be based on a measured move, calculated from the prior consolidation range. At the current price, BONK is already running over 70% in profit relative to the initial breakout zone, highlighting the strength of the current uptrend.
Momentum Indicators Reflect Sustained Buying Pressure
Shifting to the hourly time scale, the Relative Strength Index (RSI) stands at 66.58, moving steadily higher. Though inching close to entering overbought levels, RSI is below the critical level of 70, typically an exhaustion signal. The rally has been supported by this steady momentum without any sharp reversals yet, a short-term trader’s point to watch.
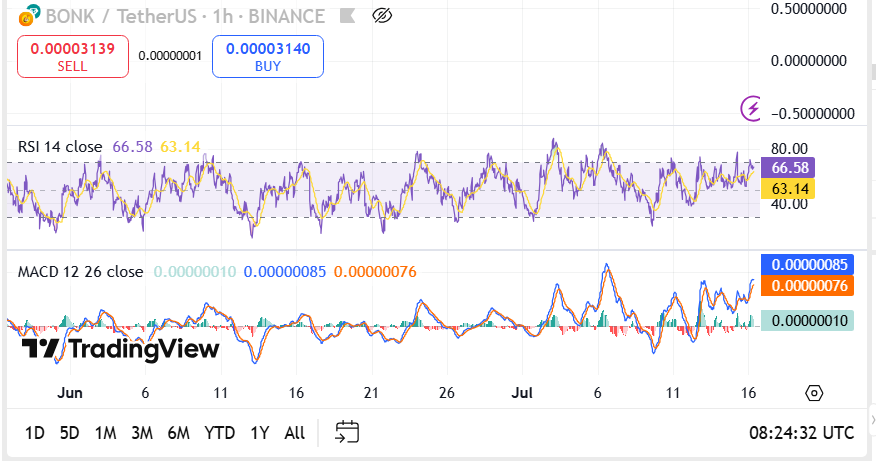
Meanwhile, the MACD (12,26) indicator reinforces the bullish position. The MACD line consistently has been above the signal line, and histogram bars have continued to be green in color since the beginning of July. The MACD’s consistent divergence from the signal line indicates building bullish momentum, especially when the price is holding above short-term moving averages.
Price Holds Above Critical Support As Market Eyes Resistance Zone
In the near term, BONK must maintain levels above its newly established support at $0.00002789 to validate the breakout structure. With price rejection around the $0.00003161 resistance level that has been experienced twice in the last sessions, the level is vital in the next bullish move. But the lack of hard sell-offs and the ongoing resilience to indicators indicate that momentum has not been lost.
As of now, BONK trades within a daily range that favors buyers. A confirmed close above the resistance may open space toward the projected target of $0.00005000. Until then, the trendline breakout remains the most significant technical development on BONK’s chart this month.


