
- Bitcoin’s key support sits at $117,400, with resistance capped at $119,167 as traders monitor consolidation.
- RSI at 55.91 reflects growing strength without reaching overbought conditions, supporting short-term bullish structure.
- MACD remains positive, with consistent histogram growth and MACD line above signal line since early July.
Bitcoin (BTC) is at $118,069 following a 1.0% decrease in price over the past 24 hours. Despite the dip, the asset remains in a broader support zone that analysts are watching closely. With a key support level at $116,787 and an immediate resistance at $119,167, market structure suggests that BTC is eyeing the $131,200 level should current levels hold. This movement is concurrent with increasing interest in high-cap digital assets as market players watch out for volatility and trend continuation signals.
BTC Price Stability Hinges on Critical Support Amid Narrow Trading Range
According to analyst ali charts, the $117,400 level has emerged as a critical support floor for Bitcoin in recent sessions. Price has maintained movement above this threshold even during short-term selling pressure. A sustained hold above this support could pave the way for further upside, especially if bulls retest the $119,167 resistance.


The recent price action has kept BTC within a narrow intraday range. The 24-hour low is anchored near $116,787, while the high touches $119,167. These levels remain closely monitored by short-term traders who are assessing the next directional move. Failure to maintain the current support zone may shift the bias temporarily, though the longer-term outlook depends on continuation above $117,400.
Resistance Zone Tightens Around $119K Region
Bitcoin’s immediate resistance remains centered near $119,167. This area has limited rallies in the latest sessions, restricting momentum in the short-run. Should BTC settle above this mark, it could leave a gap to a rally to $131,200.
The volume has been very stable and daily volatility has shrunk to areas of strategic importance. The reduction of price movement range and the reduction of daily change can be viewed as a build-up towards a possible directional break. The direction of the breakout, however, will hinge on whether resistances can be breached by bulls or whether bears will instigate a re-test of support.
Short-Term Structure Defines Range Before Potential Upside
While BTC remains flat against itself, the chart structure shows a defined pattern between support at $116,787 and resistance at $119,167. This structure has created a tightening price zone with a possible upside extension toward $131,200 if the current base holds.
The price now hovers slightly above its nearest support, maintaining a narrow margin for directional confirmation. Traders continue to monitor BTC’s stability above $117,400 as a key requirement for further gains.
Technical Indicators Reflect Strengthening Bullish Momentum
Shifting to the hourly time scale, the Relative Strength Index (RSI) is at 55.91 which has been in an uptrend. RSI is yet to exceed the critical overbought threshold of 70 and is currently trading near overbought territory. This continued momentum has sustained the stock market rally without the severe pullbacks that short term traders tend to notice.
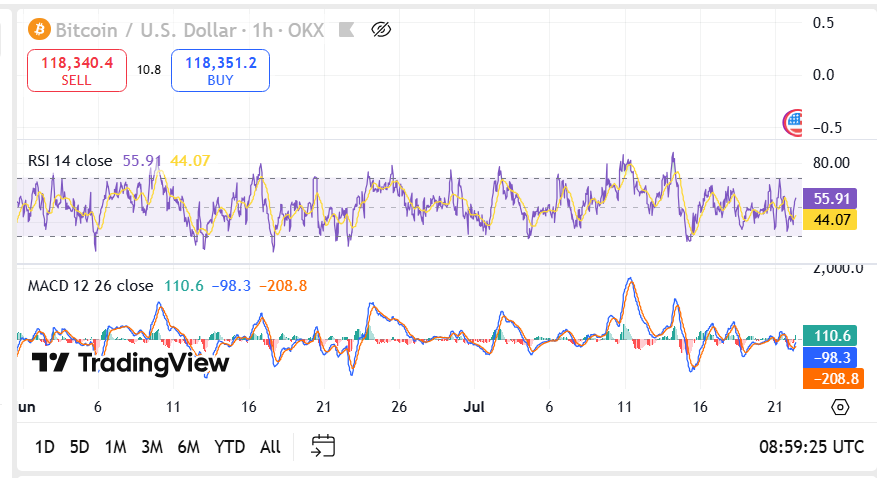
In the meantime, the MACD (110.6) sign supports a more bullish view. The MACD line has remained higher than the signal line throughout and the histogram bars have been green since early July. The fact that the MACD is farther away than the signal line suggests increased bullish pressure, given that the price also trades above short-term moving averages. Bitcoin’s structure remains intact above $117,400, with technical indicators supporting further upside toward $131,200 if momentum persists.


