
- Bitcoin is in its final bull phase, with projections targeting $100K–$300K if historical patterns hold.
- The current cycle is slower than past ones but shows stability, hinting at market maturity and reduced volatility.
- Accumulation since 2023 supports a methodical climb, indicating broader adoption and institutional interest.
Bitcoin may be approaching its next major peak within the next six months, according to historical market performance. The current recovery trend, which began after the November 2022 low, appears to follow a pattern similar to previous cycles.
Based on data and historical comparisons shared by analysts, Bitcoin’s ongoing price movement is unfolding in a more stable, less volatile manner than in the past. This shift could suggest a maturing market, shaped by institutional involvement and a gradual accumulation phase that stretched through most of 2023 and early 2024.


Recovery Pace Lags Past Cycles but Shows Stability
Compared to earlier cycles, the current upward trend remains slower. Notably, from its post-ATH low, Bitcoin has gained around 150% by mid-2025. This figure lags the 2013–2017 cycle, which recorded over 2,000% gains in a four-year span.
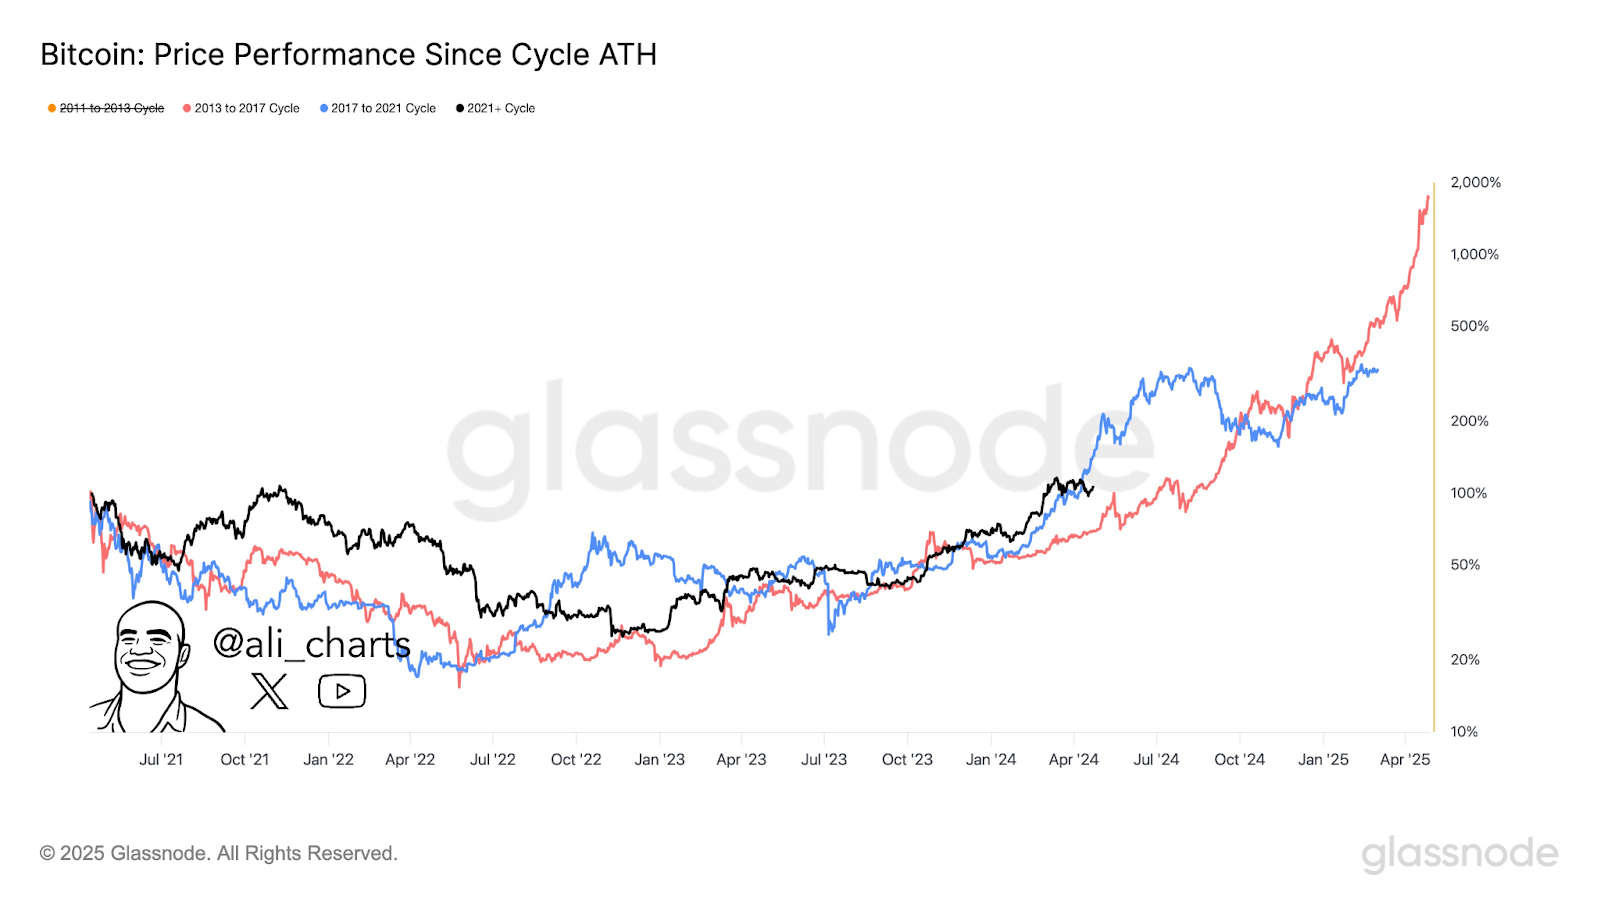
Similarly, the 2017–2021 cycle had gains of around 500% at the same stage. Despite the lag, the current recovery shows more consistency and fewer extreme drops. A visual trend comparison shows that the current cycle resembles the early stages of the 2017–2021 recovery.
However, this phase has had fewer steep declines, potentially indicating broader adoption or reduced speculative behavior. From a structural viewpoint, the trend reflects a methodical climb from a deep drawdown of more than 75% in 2022.
Cheat Sheet Suggests Final Phase of Cycle Is Underway
According to a widely circulated “Bitcoin Bull Run Cheat Sheet” by Merlijn The Trader, the ongoing cycle has entered its final growth phase. The cheat sheet outlines recurring phases seen in Bitcoin’s past: bear markets, accumulation, and eventual bullish expansions.
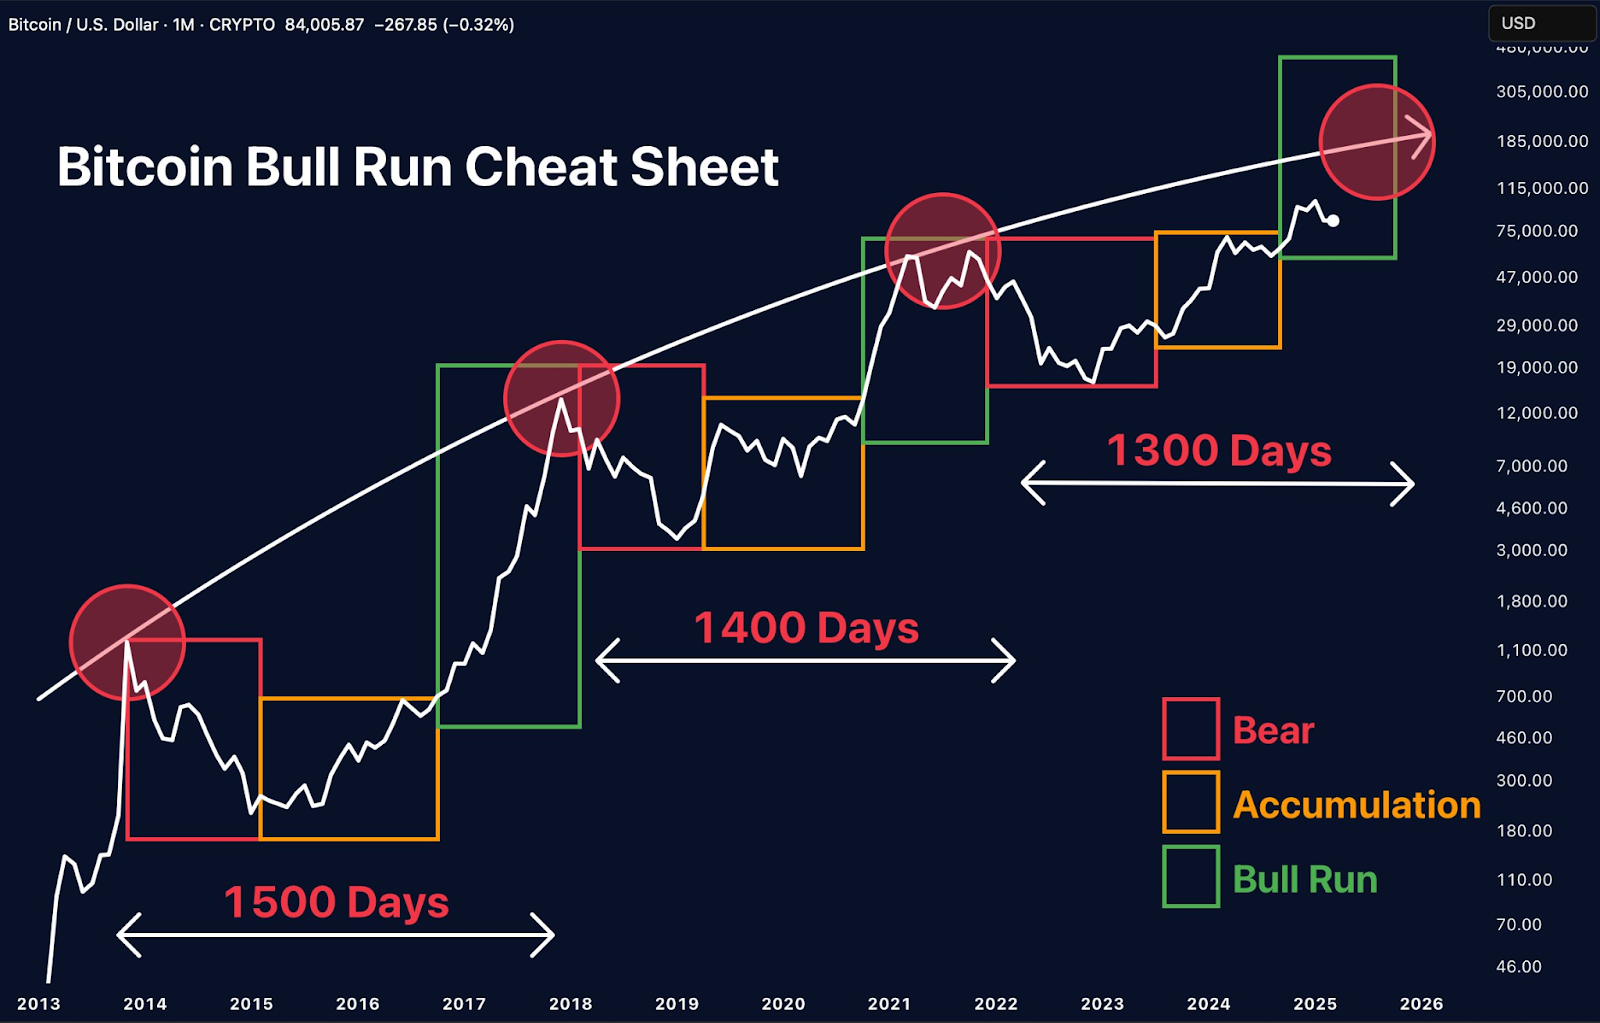
Each previous cycle has followed this pattern, with the latest following the same move since the November 2021 all-time high. The chart categorizes the 2022 decline as the red bear market phase, followed by a lengthy accumulation marked in orange.
The present period, shaded green on the chart, represents the breakout phase. Both prior full cycles lasted over 1,400 days, and the current one is projected to span roughly 1,300 days in total.
Price Targets Range Between $100K to $300K
If Bitcoin’s price growth replicates past cycles, analysts project gains between 300% and 500% from the bottom. This outlook places possible price targets between $100,000 and $140,000 by late 2025 in a steady trend.
However, based on Merlijn’s projected path, more optimistic outcomes place potential targets between $250,000 and $300,000 before the cycle completes.
While the speed of growth has slowed, the structure remains consistent with historical patterns. The ongoing cycle shows a familiar rhythm; deep correction, sideways accumulation, and renewed momentum toward a fresh peak.


