
- BTC closed above $119K for the first time, while Ethereum and BNB led altcoin strength amid bullish sentiment.
- Declining USDT and BTC dominance, alongside a rising Total3 chart, indicate growing interest in smaller-cap assets.
- Liquidity peaks and upcoming U.S. policy moves, including the Market Structure Bill, may define the next macro turning point.
Bitcoin made the highest weekly closing price in its history this week, closing above 119,000. This follows a time when the macroeconomic tensions have subdued and as the move gathers pace among key altcoins.
With the general crypto market starting to consolidate, the data shows that the bullish trend may carry on, as altcoins are gaining popularity and new capital investments are altering market positions. The market is showing signs of growth in terms of strength meter and technical indicators as well as structural indicators, and there is a resurgence of investor interest across digital assets.


Currently, Bitcoin is trading at $118,917 with a 0.7% increase, the support is held at $117,914 and the resistance level is at $119,754. Furthermore, the two are still recording new lows on the four-hour chart, signaling ongoing upward pressure. The overall market structure is constructive with prices above the rising trendline of recent swing lows.
Ethereum and BNB Drive Altcoin Strength
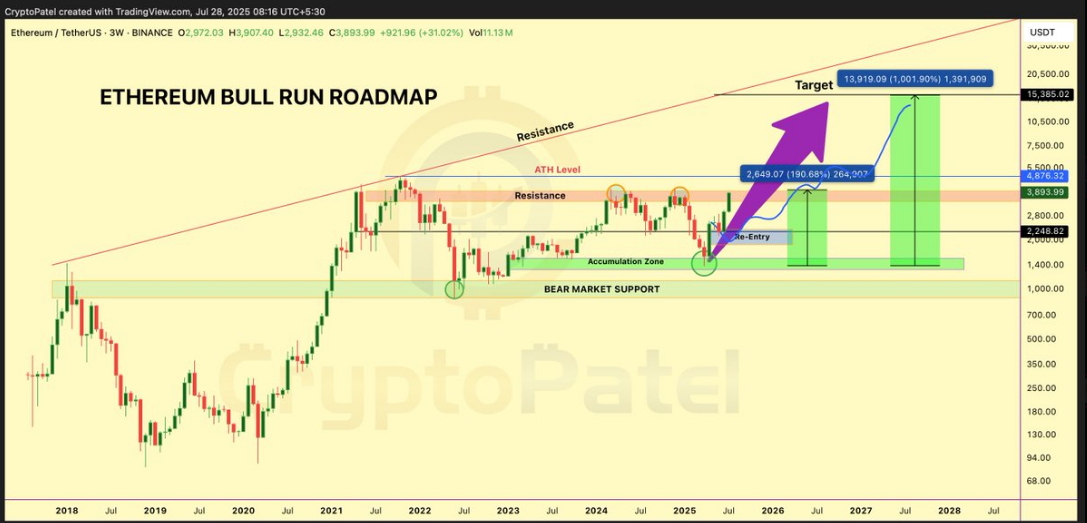
Ethereum performed well last week, surging above $3,800 and marking numerous consecutive daily gains. Despite reaching overbought levels, the price of Ethereum just kept on rising, which signals persistent buying interest. Ethereum is likely to break above $4,000 in the near future, according to analysts, with probable short-term resistance of $4,200 to $4,300.
At the same time, Binance Coin (BNB) reached new all-time highs, another key milestone of this cycle. This price action accompanies the same rotation of liquidity within the crypto market. After Bitcoin reached $123,000 and entered overbought levels, capital started pouring into big altcoins such as ETH, XRP, and BNB. This is in harmony with the same patterns observed in previous bull cycles.
Capital Rotation Accelerates as USDT and Bitcoin Dominance Decline
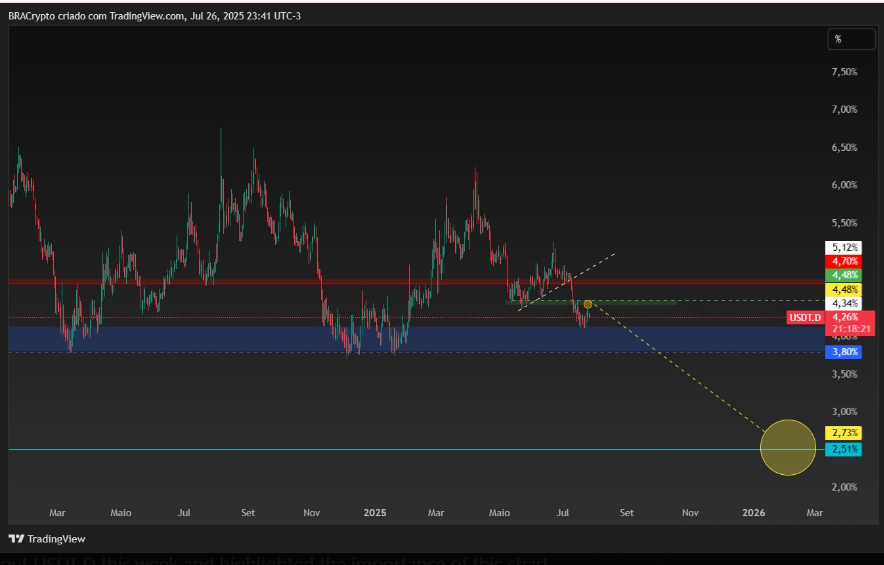
Recent data shows a continued breakdown in USDT dominance, now approaching the critical 4.0% level. A move toward 3.6% may lead to wider liquidity dispersion across Bitcoin and altcoins. Simultaneously, Bitcoin dominance is also declining, signaling that capital is shifting away from Bitcoin and into other digital assets.
The “Total3” chart, which excludes Bitcoin, Ethereum, and stablecoins, is breaking to the upside. This trend suggests rising investor interest in smaller-cap assets. These shifts are occurring in parallel with macroeconomic relief, including the 90-day extension of the U.S.–China tariff pause and a newly signed trade agreement between the U.S. and the EU.
Timing and Market Structure Bill Could Influence Cycle Peak
Indicators are aligning around late October to early November as a possible timeframe for a local cycle top. One key factor is global liquidity data, which currently shows a peak forming around late October. Historically, crypto prices have lagged behind liquidity movements by a few months.
Additionally, the U.S. Congress is expected to vote on the Market Structure Bill in September. Additionally, the two are still trading above previous lows on the four-hour chart, which signals the presence of upward momentum. The market structure is bullish in general and price is trading above the ascending trendline formed by late swing lows.


