
- ETH/BTC rebound hints at capital rotation from Bitcoin to Ethereum
- Ethereum’s surge past $3K backed by strong momentum and bullish signals
- Overbought RSI warns of a short-term pullback despite broader bullish trend
Ethereum is once again in the spotlight as market optimism mounts around a bold price prediction from a top crypto figure. Arthur Hayes, the former CEO of BitMEX and one of the most closely watched voices in the space, has reignited discussions around Ethereum’s potential to hit $10,000. This isn’t just noise. It’s rooted in real signals from the market. The ETH/BTC trading pair is showing signs of reversing a prolonged downtrend.
Meanwhile, ETH’s dollar value has gained momentum, hinting that a deeper shift may be underway. With macro pressures easing and technical charts flashing bullish cues, many traders now believe that Ethereum’s path to five figures may be more realistic than ever.


Arise Chikun, it's time…$ETH = $10,000
— Arthur Hayes (@CryptoHayes) July 10, 2025
Yachtzee😍😍😍😍😍😍😍😍 pic.twitter.com/zRGlPh9LTJ
ETH/BTC Pair Signals Momentum Shift
The ETH/BTC chart has been a source of concern for nearly two years, stuck in a persistent downtrend. However, that trend appears to be changing. Ethereum recently bounced off multi-year lows against Bitcoin.
If it maintains this rebound, the pair could aim for the 0.055 BTC mark more than double its recent levels. That kind of movement would reflect serious relative strength and potentially attract capital rotation out of Bitcoin and into Ethereum.
This comes as Ethereum itself is staging a breakout in dollar terms. Recently surpassing $3,000, ETH has climbed nearly 19% in the past week. The price action is not yet parabolic, but momentum is clearly building. In the past 24 hours alone, the token surged almost 9%, lifting its market cap above $364 billion.
Technical Indicators Support the Surge
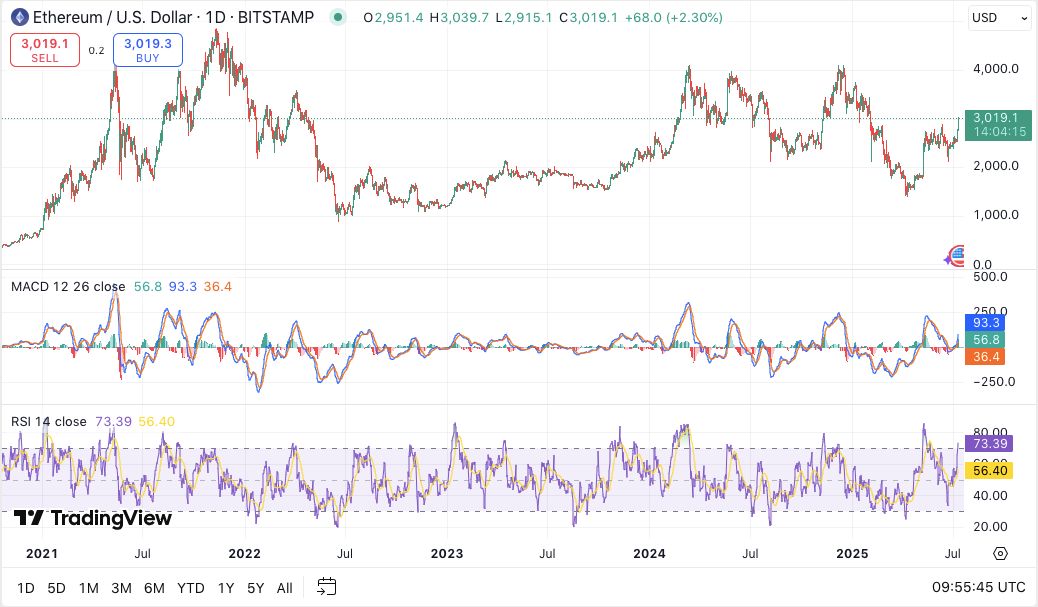
From a technical standpoint, Ethereum’s rally is backed by growing bullish indicators. The MACD is positive, with the line above the signal and trending upward. This signals growing buying pressure. Additionally, histogram bars are expanding, which usually reflects strengthening trend momentum.
However, not all indicators are flashing green. The RSI has pushed into overbought territory at 73.68. Historically, such readings suggest the possibility of a near-term pullback or sideways consolidation. Hence, traders should remain cautious, especially in the short run.


