
- ADA trades at $0.7792, down 2.25% in 24 hours, with key resistance at $0.98. A breakout could push it toward $1.16 and $1.35.
- The “death cross” on ADA’s signals bearish momentum, with the token struggling to reclaim the 50 day and 200 day moving averages.
- If ADA fails to break resistance, it may retest $0.69 support, while a move above $0.81 could revive bullish sentiment.
On February 18, at press time, Cardano (ADA) was trading at $0.7792, a 2.25% decline in the past 24 hours. The token has dropped by 2.15% over the past week and 25.25% in the past month. With a market cap of $27.34 billion, ADA is a key asset in the crypto market.
Resistance Levels and Breakout Potential
According to analyst Rose, ADA is at an important level, forming a descending wedge pattern on the daily timeframe.


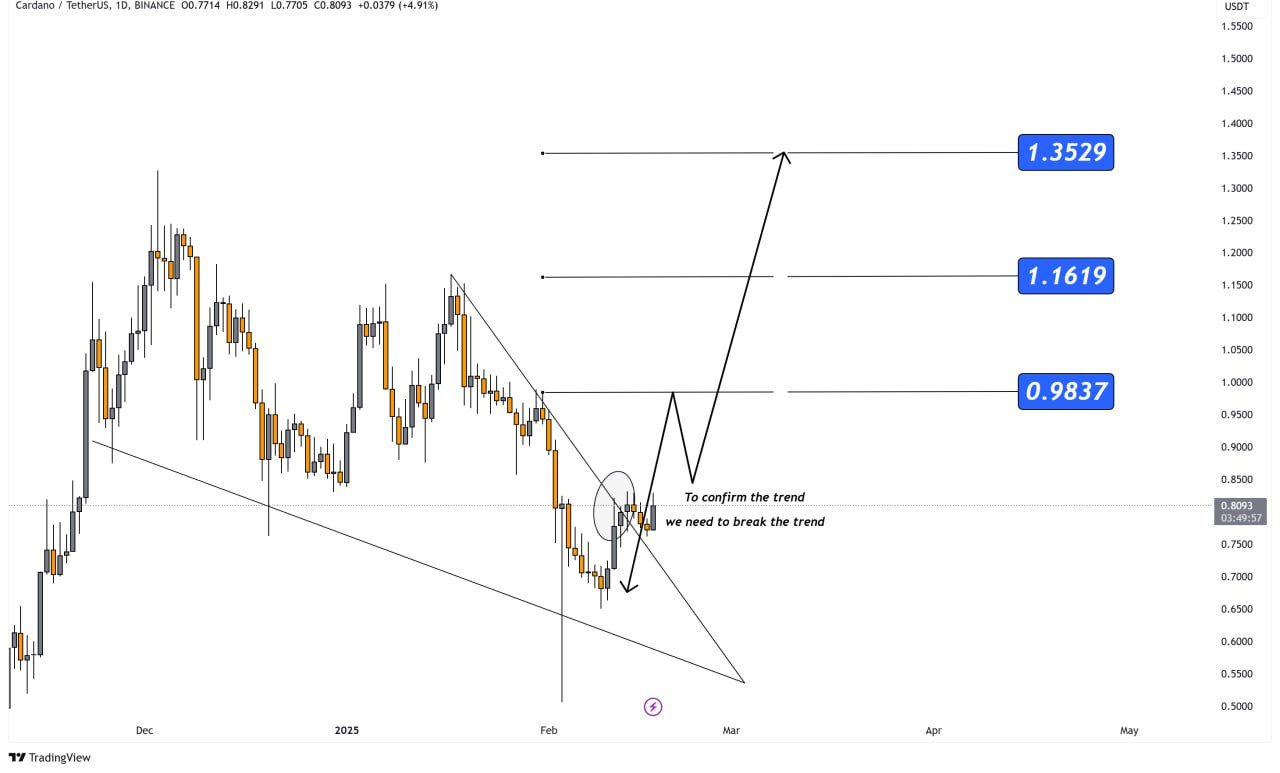
en suggests a potential bullish reversal if the price breaks upward. The resistance levels include $0.98, the first resistance level and a psychological barrier that ADA must surpass for bullish confirmation.
The next level is $1.16, a mid level resistance point that aligns with historical price move and Fibonacci retracement zones. $1.3529 is a bullish target that could indicate an extended breakout scenario.
For ADA to confirm an upward trend, it must break and hold above $0.98. If successful, momentum could push the price toward $1.16 and later $1.35. However, failing to break these levels could result in a pullback, potentially retesting lower support zones.
Moving Averages and Market Sentiment
The 50 day moving average is at $0.818, while the 200 day moving average is at $0.88. ADA is below both indicators, a weak bullish momentum since early February.
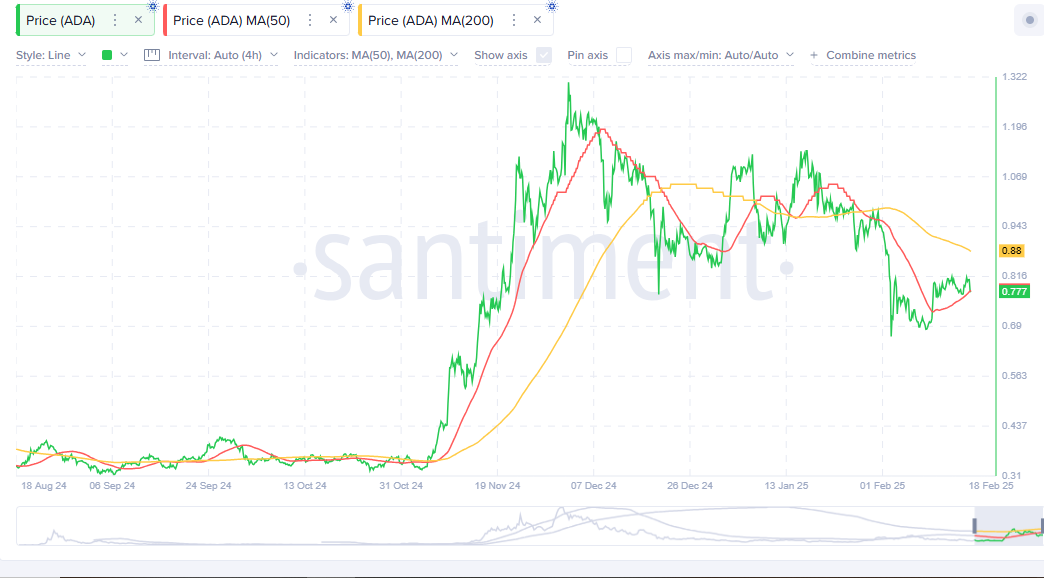
A bearish signal emerged in mid January when the MA50 crossed below the MA200, forming a “death cross.” This pattern suggests a prolonged downtrend. Since late December, ADA has struggled to reclaim the MA200, further confirming bearish pressure.
If ADA manages to break above $0.81, it could retest $0.88, an important level for trend confirmation. However, failing to reclaim these levels may lead to further downside movement.
Support Levels and Potential Price Scenarios
If ADA fails to break above the descending trendline, it could face renewed selling pressure. The primary support level to watch is $0.69, a recent low in February. A rejection from resistance levels might lead ADA to retest this support before attempting another breakout.
A successful move above the 50 day and 200 day moving averages could restore bullish momentum. However, sustained failure to reclaim these levels may result in further downward movement before another recovery attempt.


