- ADA trades below its 50-day MA at $0.821, showing short term weakness despite holding above the 200-day MA at $0.708.
- Daily active addresses fell from 50K to 24.4K, weakening the momentum behind ADA’s July rally.
- MACD shows a bearish crossover, and RSI at 52.83 indicates fading momentum near resistance at $0.8000.
Cardano (ADA) is showing signs of vulnerability as it struggles to maintain key support levels. At press time on July 30, ADA was trading at $0.780, a 2.84% decline in the past 24 hours and a 10.43% drop over the week.
Despite these losses, ADA remains up by 37.5% over the past month. Market cap is at $27.59 billion, a 2.93% decrease, while 24 hour trading volume fell by 27.27% to $866.1 million. These figures, with falling on-chain activity, suggest weakening short term interest.


Declining Address Activity Undermines July’s Rally
Network data shows a sharp drop in daily active addresses, which have fallen to around 24.4K from highs above 50K earlier in July. This decrease follows ADA’s price peak above $0.90 in mid July, driven by strong user activity and rising momentum.
However, with declining participation, the sustainability of that rally is now in question. The 50 day moving average, at $0.821, now acts as a resistance zone, having fallen above the spot price.
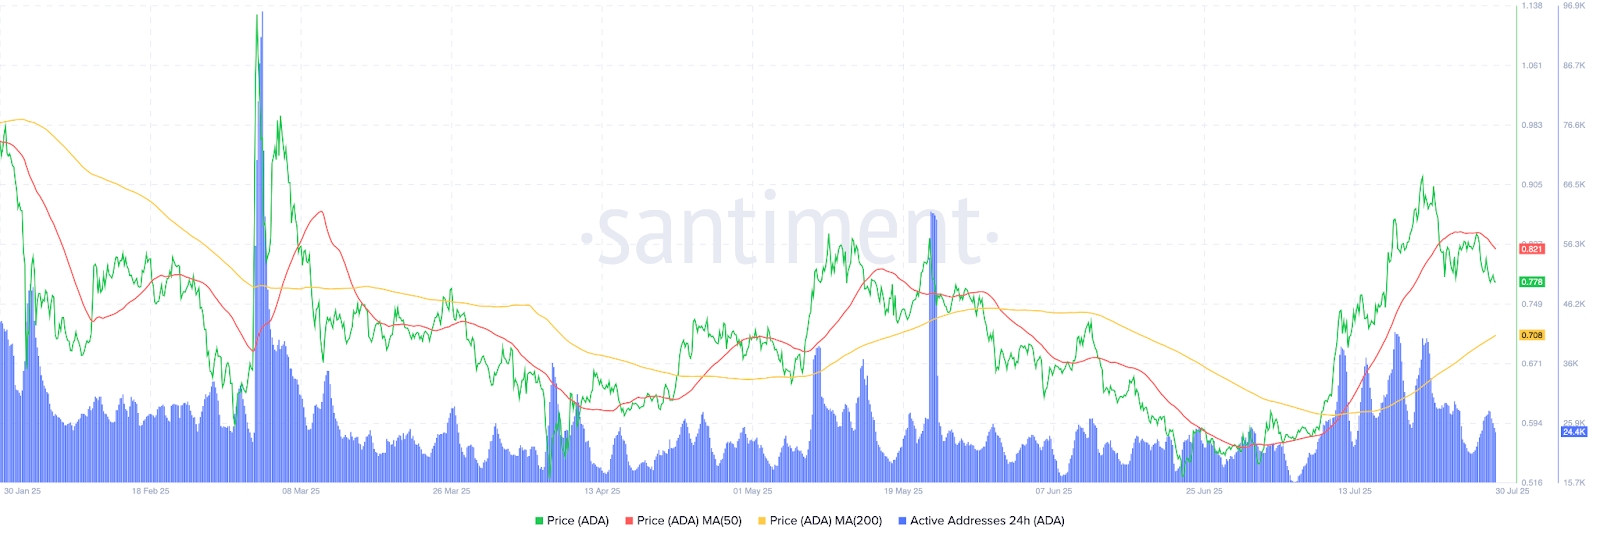
Meanwhile, the 200 day moving average is at $0.708, supporting a longer term bullish outlook. ADA’s position between these two averages suggests indecision, with short term weakness emerging against long term optimism.
Technical Indicators Show Mixed Momentum
Cardano’s RSI is at 52.83, placing it near the neutral zone but leaning slightly bullish. It recently cooled off from an overbought level of 68.70, indicating fading upward momentum.

The MACD shows a bearish crossover, with the MACD line at 0.0368 falling below the signal line at 0.0480. The histogram value of -0.0112 supports a short-term bearish view. Support is at $0.7700, with stronger backing near $0.7400.
Resistance is at $0.8000, with more pressure expected near $0.9000, Cardano’s recent peak. Price action has now consolidated between $0.74 and $0.80 as volume weakens and the market seeks direction.
Price Action and Structure Show Caution
Since mid June, ADA has risen from below $0.60, peaking above $0.90 before entering its current consolidation range. The price is above the 200-day moving average, which offers structural support.
However, it trades below the 50-day moving average, suggesting near term weakness. The volume-to-market cap ratio at 3.1% adds to the cautious outlook, showing reduced transaction intensity relative to ADA’s valuation.
Potential Prices for July 31
On the upside, if ADA breaks above $0.7850 with increasing volume and address activity, it could climb toward $0.81–$0.83. However, if ADA fails to hold $0.770, further losses could push it down to the $0.740–$0.720 zone.
Overall, Cardano’s near term trend is shaped by declining activity, weakening momentum, and tightening technical levels. Its ability to reclaim key resistances, especially the 50-day moving average, will be crucial in determining the next move.
Disclaimer : The content shared by The Daily Crypto Post is intended for informational and educational purposes only and does not constitute financial or investment advice. Readers are encouraged to do their own research or consult with a licensed professional before making any financial decisions. The Daily Crypto Post will not be accountable for any financial losses.


