
- PEPE tests critical $0.00001300 support amid declining volume and mixed signals.
- RSI signals overbought, but MACD shows weakening momentum, hinting at pullback.
- Holding above EMAs suggests strength, yet volume drop raises caution for bulls.
As the cryptocurrency market grapples with increased volatility, PEPE token finds itself at a critical juncture. Priced at $0.00001326 as of May 15, the meme coin has experienced a sharp 5.63% drop over the last 24 hours. This recent dip puts the token just above a significant support zone. Traders are closely watching this level, as a breakdown could trigger further losses.
Conversely, a bounce could offer a short-term recovery opportunity. With declining volume, mixed technical indicators, and a saturated supply, PEPE’s near-term outlook hangs in the balance.


Price Action and Support-Resistance Dynamics
PEPE has been in a steady decline, forming a clear pattern of lower highs and lower lows. This trend indicates persistent bearish sentiment. The current price sits just above a key support level at $0.00001300.
If the price holds here, the token may consolidate or see a slight recovery. However, a dip below this level could expose the next support between $0.00001290 and $0.00001300.
On the upside, resistance looms at $0.00001400 and $0.00001417. These levels have previously capped upward movements, signaling strong selling interest. Any bullish move will need to clear these hurdles to confirm a trend reversal.
Technical Indicators Point to Mixed Signals
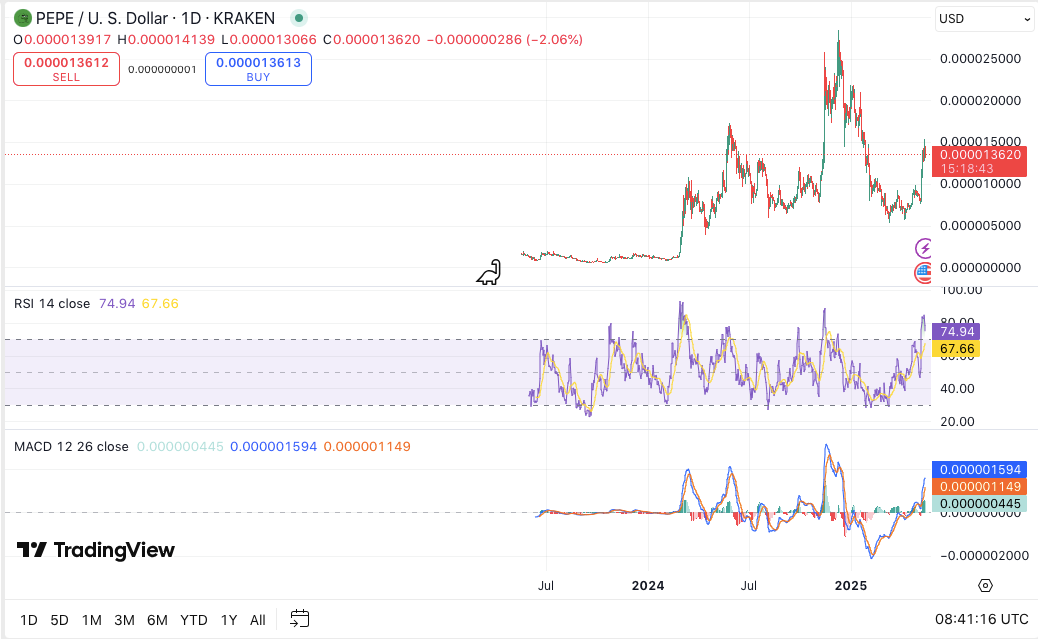
The Relative Strength Index (RSI) currently stands at 74.31, signaling an overbought condition. Although this typically suggests a pullback is likely, PEPE has shown a tendency to respect RSI extremes in the past. Hence, a period of consolidation could follow.
Meanwhile, the MACD indicator still shows bullish momentum with the MACD line above the signal line. However, the histogram reveals a loss of upward force. This could hint at a near-term slowdown or reversal if selling pressure continues.
Volume and Moving Averages Raise Caution
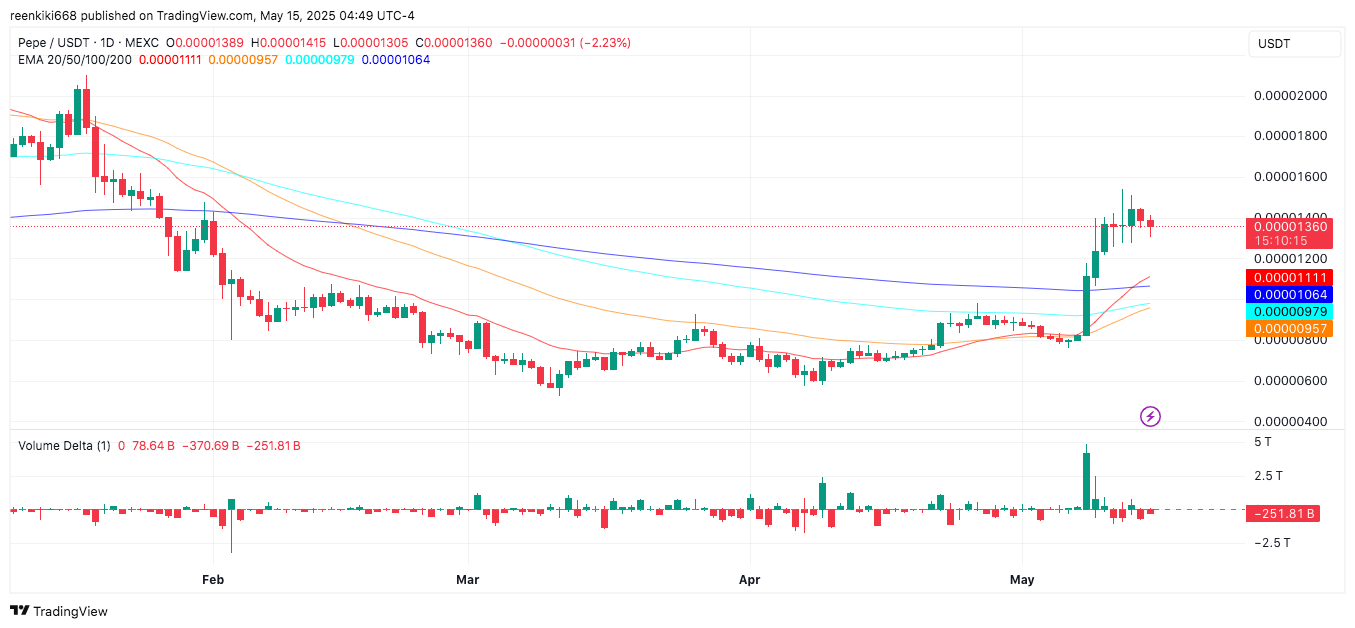
Trading volume has dropped by over 43%, with a daily turnover of $1.14 billion. This significant decline suggests reduced trader participation and potentially lower volatility in the short term. The negative volume delta of -286.53 billion further indicates more selling than buying.
Despite these concerns, PEPE remains above its 20, 50, 100, and 200-day EMAs. This alignment typically reflects strong bullish momentum. Notably, the 20 EMA crossing above longer-term EMAs supports the case for continued strength, but only if volume and sentiment improve.
Outlook for May 16
PEPE’s price direction on May 16 will depend on whether support at $0.00001300 holds. If buyers step in, a bounce could test resistance levels. Otherwise, a break below could send prices into the lower $0.00001290 zone.


