
- SHIB Holds Strong Amid Market Crash, Gains 4.71% Despite Crypto Sell-Off
- Key Support at $0.00001300, Resistance at $0.00001500 Could Define SHIB’s Next Move
- RSI Nears Oversold Zone, MACD Signals Possible Bullish Reversal for SHIB
The cryptocurrency market is experiencing a major downturn, with Bitcoin and several altcoins witnessing sharp declines. Bitcoin plummeted from the $96,000 level to $88,594.89, losing 0.54% in just a day. Many top 20 and top 100 cryptocurrencies have also fallen by significant margins, some by over 50%.
Despite this widespread sell-off, Shiba Inu (SHIB) has maintained strength, registering a 4.71% daily gain. Its market cap increased to $8.42 billion, even as its 24-hour trading volume dropped by 25.27% to $341.78 million. The price has rebounded from recent lows, forming a bullish trend with multiple higher highs.


Price Trend and Key Support Levels
Shiba Inu has demonstrated a resilient price trend, currently standing at $0.00001429. The price initially dipped but later reversed, maintaining steady upward momentum. If SHIB faces downward pressure, support levels at $0.00001363 and $0.00001300 could act as cushions against further declines.
The $0.00001363 mark previously acted as a turning point before recovery, while the $0.00001300 level represents a strong psychological barrier. If the price retraces, these levels will be crucial in determining whether SHIB can sustain its gains or fall further.
Resistance Levels and Bullish Prospects
On the upside, SHIB is approaching a short-term resistance zone between $0.00001440 and $0.00001450. Breaking past this range could signal a stronger bullish momentum, potentially leading to a test of the major resistance at $0.00001500.

Round numbers often serve as strong price barriers in crypto trading, making $0.00001500 a crucial level to watch. If SHIB surpasses this point with significant volume, further price appreciation could follow. However, failure to breach resistance could trigger a pullback toward lower support zones.
Market Flows and Technical Indicators
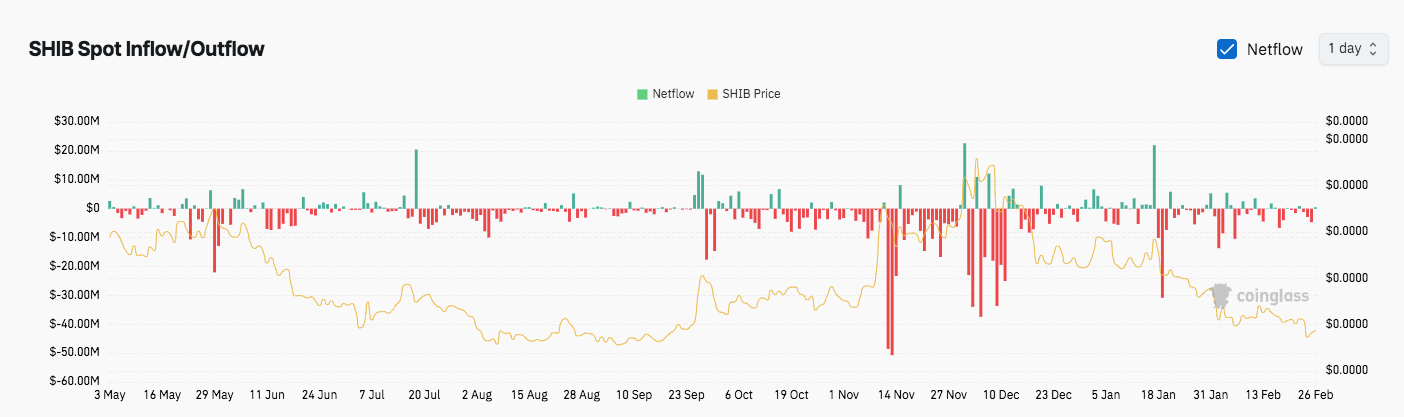
Analyzing SHIB’s spot inflow and outflow trends reveals significant market activity. Large outflows exceeding $40 million were recorded in mid-May, early November, and late November, indicating strong selling pressure.
Meanwhile, sporadic inflows above $20 million occurred in late July, early October, and late November, but these were not enough to sustain prolonged price recovery. The price has generally followed these inflows and outflows, dropping when outflows dominate.
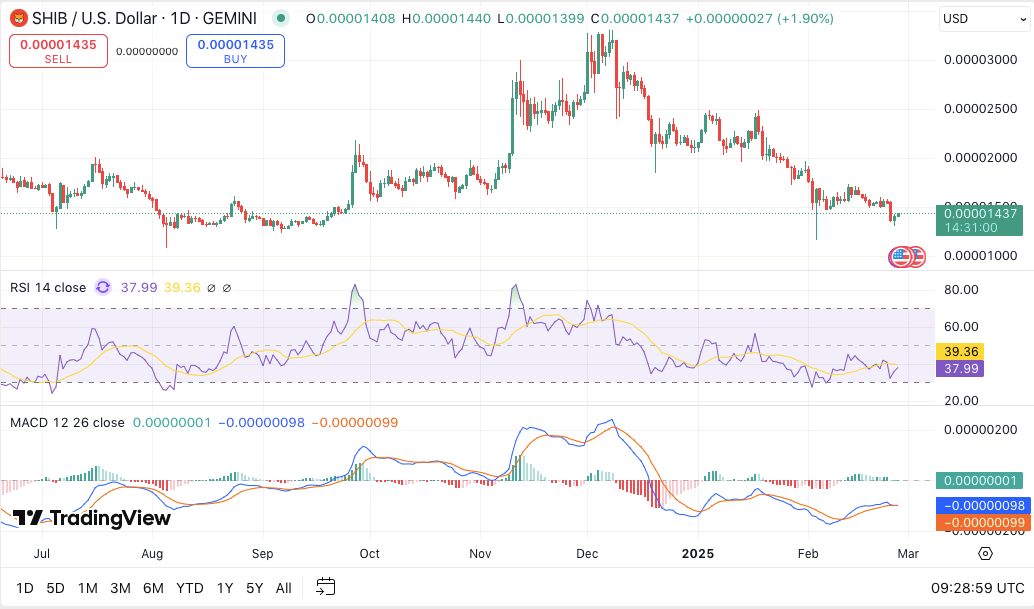
Technical indicators provide further insight into SHIB’s outlook. The Relative Strength Index (RSI) currently stands at 37.67, signaling that SHIB is near the oversold zone. If selling pressure eases, a potential rebound could occur.
The Moving Average Convergence Divergence (MACD) remains in bearish territory, with the MACD line at -0.00000098 and the signal line at -0.00000099. However, these values are close to crossing over, suggesting that a price recovery may be on the horizon if buying momentum increases.


