
- PI is trading at $0.6414, near a crucial support level, with weak RSI at 40.73 and a bearish MACD indicating low bullish momentum.
- Price remains stuck below 50 and 200-day MAs, suggesting a strong bearish trend with limited breakout attempts since April.
- A break above $0.66 may lead to a short-term rally to $0.70–$0.72, while failure below $0.64 risks drops to $0.60 or $0.58.
The price of Pi (PI) is near an important support zone, with data suggesting increasing pressure from the technical side and broader market side. Following a multi-week decline, the digital asset has stabilized near a narrow trading range, showing signs of both weakness and potential accumulation.
Trading volumes remain low and price action is near the $0.64 support level. The market remains cautious, waiting for clear signals on whether the asset will rebound or slide further. At press time, PI was trading at $0.6414, showing an 8.86% monthly gain, yet down 13.58% over the past week.


Persistent Downtrend with Weak Momentum
Pi’s RSI is at 40.73, staying below the neutral 50 line. This reading implies limited bullish strength and with a risk of additional downside without reaching oversold levels. The MACD line is at -0.0311, with the signal line at -0.0121.
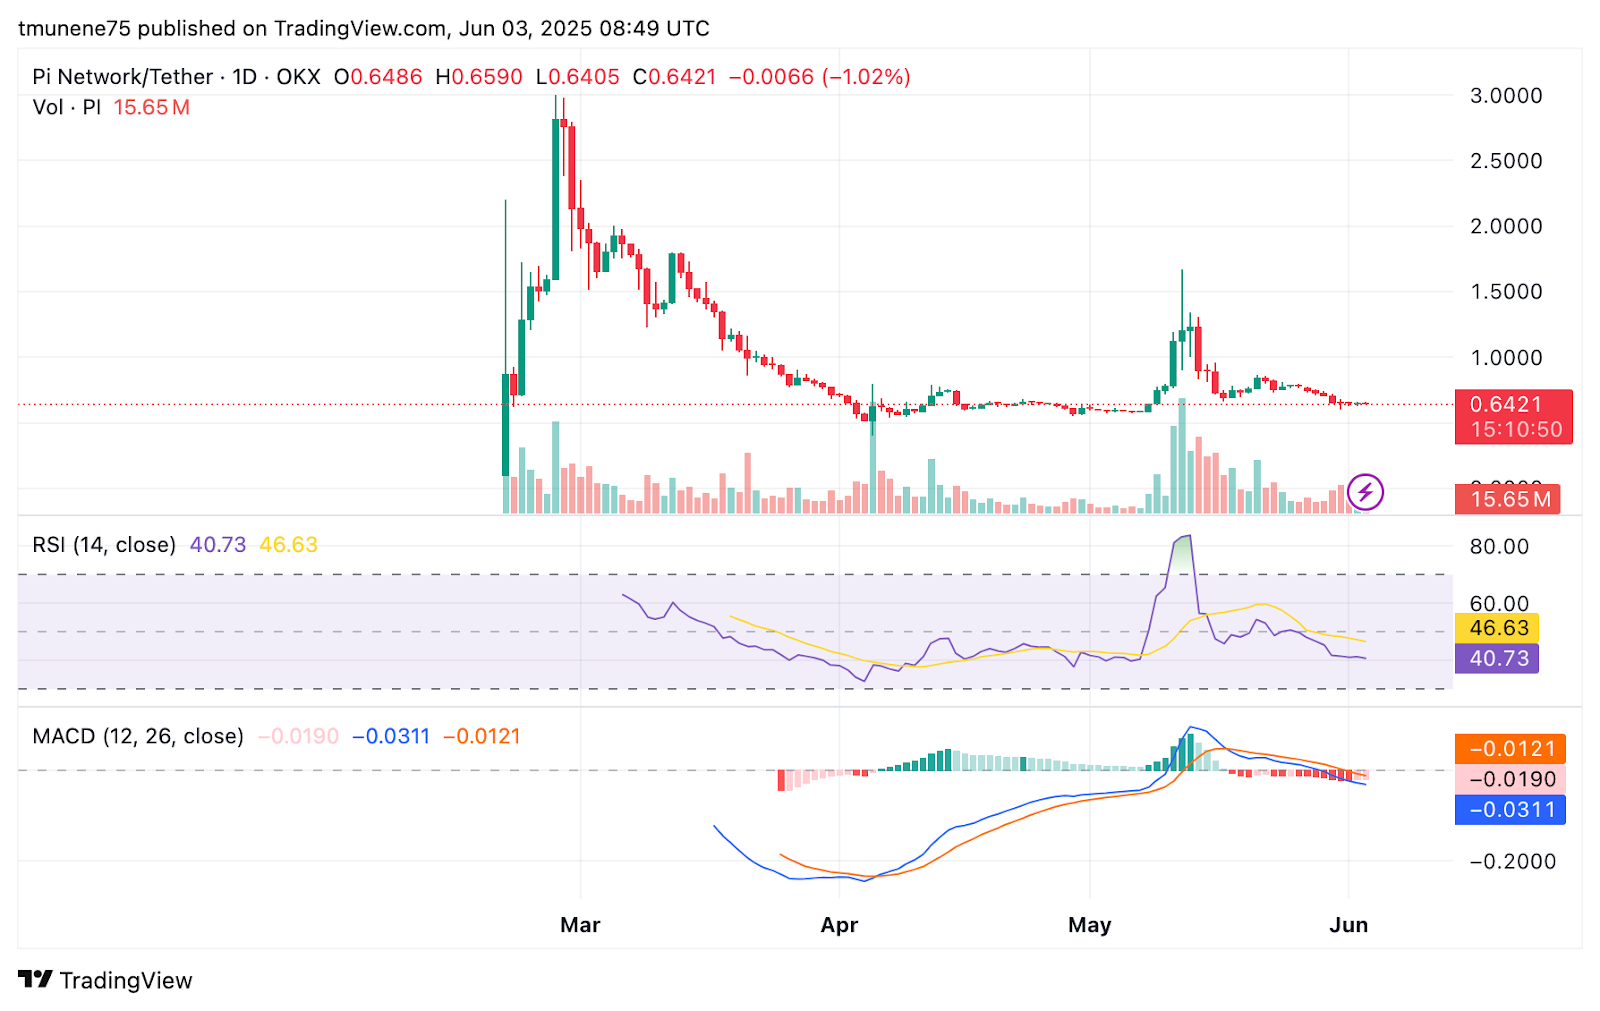
The negative histogram of -0.0190 supports the observation of sustained bearish divergence. However, the narrowing gap between these MACD lines may suggest that pressure could ease if trading volume increases.
Moving Averages and Price Behavior
Looking at longer-term trends, the 50 day moving average is at $0.691, while the 200 day moving average is at $0.755. Both averages are above the current price, indicating the broader bearish trend.
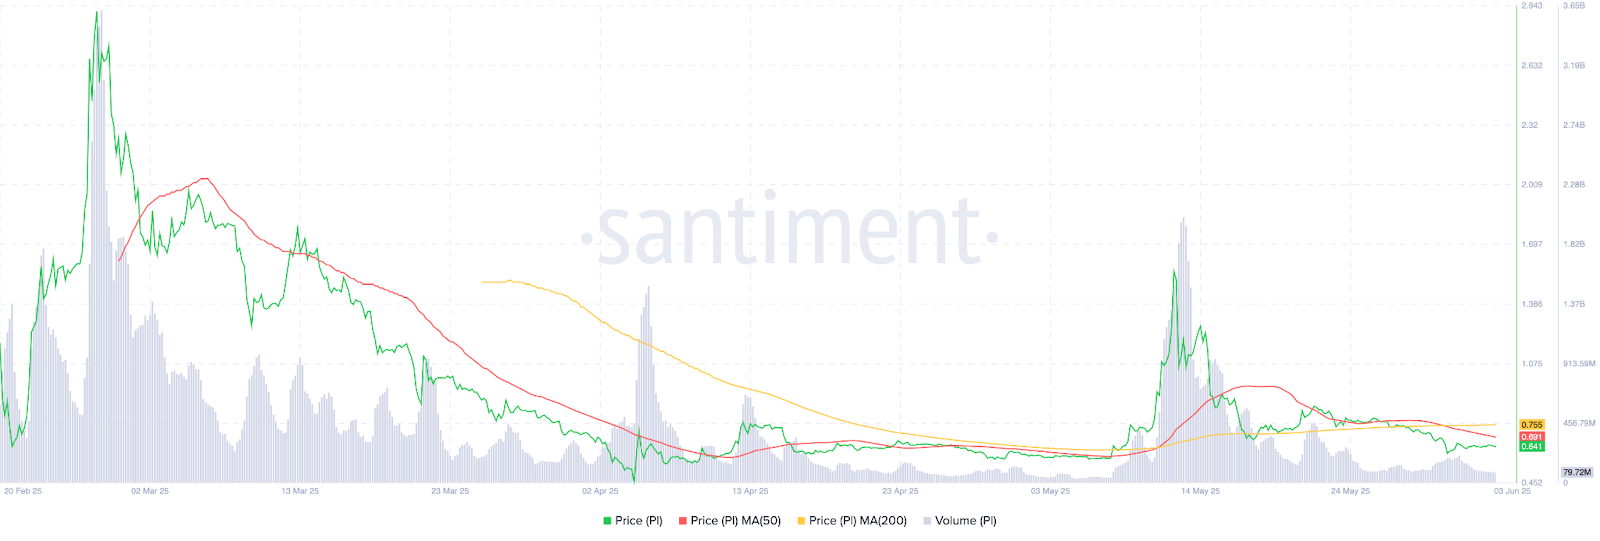
The price has failed to reclaim either level despite brief spikes, including a jump in late April that pushed the price to $1.50. Since then, Pi has settled into a consolidation phase. Volume has decreased majorly since February highs, with the latest daily total at 79.72 million, suggesting subdued interest or a potential accumulation base.
Short-Term Breakout Possible on Increased Volume
The daily trend shows consistent lower highs and lower lows since peaking above $3.00 in March. However, the recent flattening of price between $0.60 and $0.70 could indicate a stalemate between buyers and sellers.
If bulls reclaim the $0.66 level and push toward the 50 day moving average at $0.691, short-term recovery may be achievable. On the other hand, continued weakness below the $0.64 mark may lead to further losses.
Potential Price Targets for June 04, 2025
In a bullish scenario, PI may climb to $0.70 or $0.72 if it breaks $0.66 with rising volume. In a bearish outcome, if $0.64 fails, prices may fall to $0.60 or even $0.58 on declining sentiment. Overall, Pi (PI) is technically weak but appears to be entering a decisive price zone. Recovery or breakdown depends on volume and short-term momentum.


