- XRP ETF speculation fuels bullish sentiment, with an 81% approval probability.
- Hidden bullish divergence hints at a potential strong XRP price recovery.
- Sustained outflows signal selling pressure, but key inflows could drive gains.
XRP is displaying strong bullish signals despite a recent price decline. Analysts believe its price could surge soon, supported by technical indicators and increasing speculation about a potential XRP exchange-traded fund (ETF).
Although XRP dropped 3.90% in the past 24 hours to $2.56, it has gained 1.63% over the past week. The token’s market cap stands at $148 billion, with a 24-hour trading volume of over $4.1 billion. Analysts highlight the significance of technical patterns and capital flows, indicating that a major price movement could be approaching.


Analysts Predict a Strong Upside Move
Javon Marks, a crypto analyst, pointed out a hidden bullish divergence on XRP’s chart. He noted that this divergence is forming in a textbook manner, suggesting that a continuation move higher is only a matter of time.
Given the size of the current pattern, he believes the next upward move could be significant. Hidden bullish divergences often indicate that selling pressure is weakening, potentially leading to a strong recovery.
Armando Pantoja, another analyst, emphasized XRP’s resilience, stating that it has been bouncing solidly off support levels. He believes XRP will eventually reclaim its position among the top cryptocurrencies.
With Polymarket showing an 81% probability of an XRP ETF approval this year, bullish sentiment is gaining momentum. The ETF speculation could serve as a major catalyst for XRP’s next rally.
$XRP is showing ridiculous strength! 🚀 Bouncing solidly off support, it’s inevitable that it will reclaim its spot as a top crypto. With an 81% chance on Polymarket for an XRP ETF this year, the stars are aligning. Get ready for lift-off! #XRP https://t.co/WNf7oFqNgj pic.twitter.com/A7tN1fno1n
— Armando Pantoja (@_TallGuyTycoon) February 18, 2025
Market Data and Price Trends
XRP’s inflow and outflow data indicate strong selling pressure. The spot inflow/outflow chart reveals that netflows have remained negative, with outflows frequently exceeding $100 million from December to February.
Despite occasional inflows surpassing $200 million in early December and late January, overall selling pressure has persisted. The price surged above $3 in January but later stabilized around $2.50, following increased outflows. Sustained outflows suggest ongoing selling activity, whereas sharp inflows have historically driven price increases.
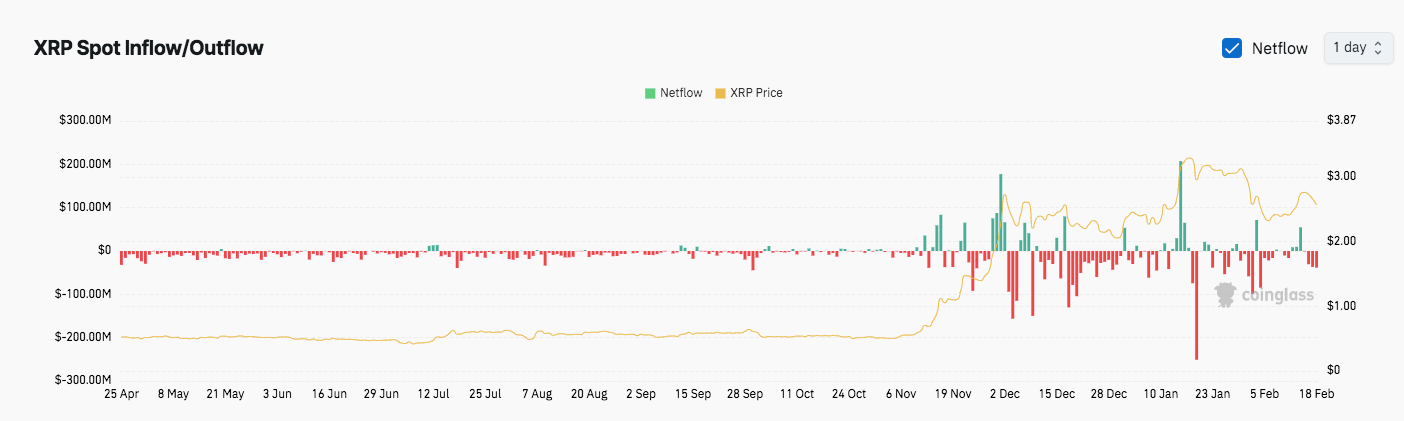
The $200 million inflow level remains a key threshold. When inflows exceed this level, XRP’s price gains momentum. Conversely, high outflows correlate with price declines. If accumulation resumes, the price could gain traction, leading to another breakout.
Technical Indicators Suggest Potential Reversal
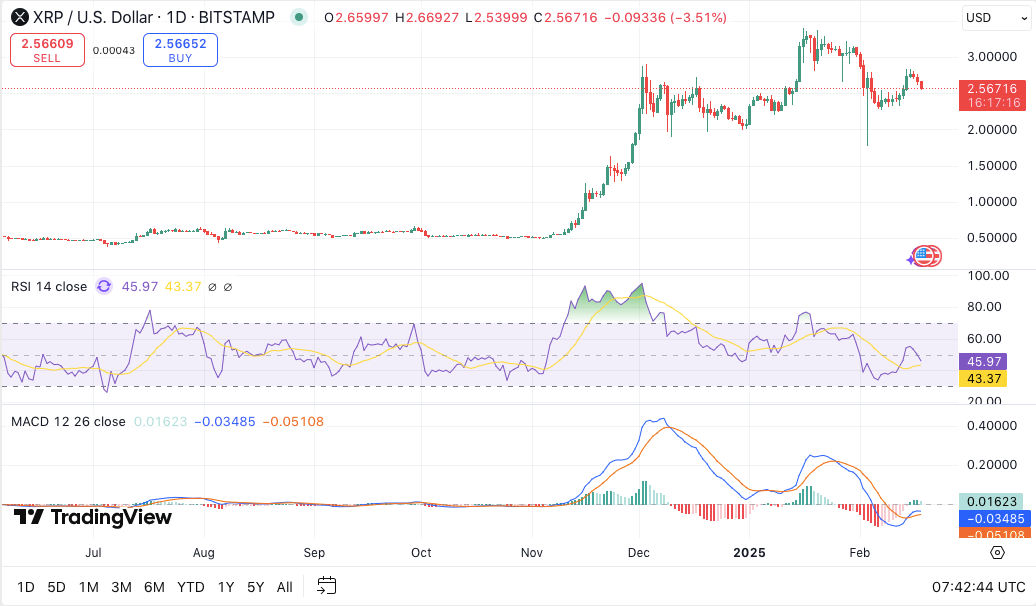
XRP’s technical indicators provide mixed signals. The Relative Strength Index (RSI) currently stands at 46.13, indicating weak momentum but no oversold conditions. A move above 50 could signal the start of a bullish trend.
The Moving Average Convergence Divergence (MACD) also hints at a potential reversal. The MACD line remains below the signal line, suggesting bearish momentum. However, the histogram shows weak bullish divergence, which could indicate an upward shift if buying volume increases.


