- XRP faces resistance at $2.20 and must break $2.50 to regain bullish momentum. A drop below $2.00 could lead to further declines.
- RSI at 42.28 signals bearish momentum, but a move above 50 could indicate a trend reversal toward the $2.50-$3.00 range.
- Increased trading volume shows active market participation as traders react to price swings and key support levels.
Ripple’s XRP is having it hard to stay above $2.17 after a sharp drop over the weekend. The digital asset saw a steep decline, falling to $2.08 on Sunday, a 22% drop in just two days. Despite a brief recovery, XRP remains in a vulnerable position.
Market Performance and Key Metrics
At press time, on March 10th, XRP was trading at $2.17, a 6.80% decline in the last 24 hours. Over the past week, the asset has dropped by 18.34%, while the monthly performance shows an 8.91% decrease.


The market cap is at $126.42 billion, down by 6.84%, while 24 hour trading volume has surged by 139.30% to $7.25 billion. This volume increase suggests active market participation as traders react to price movements.
The cryptocurrency has had a daily trading range between a high of $2.2037 and a low of $2.0872. Market sentiment is mixed, with attempts at recovery facing resistance. Notably, XRP’s total supply is 99.98 billion, with 58.04 billion currently in circulation.
Technical Indicators and Market Trends
XRP’s price action shows a persistent downtrend since reaching a peak above $3 in early February. Lower highs and lower lows have been forming, indicating continued weakness. The primary support level is at $2.17, while resistance is at $2.20 and $2.50. If prices break above resistance, further upside movement may follow.
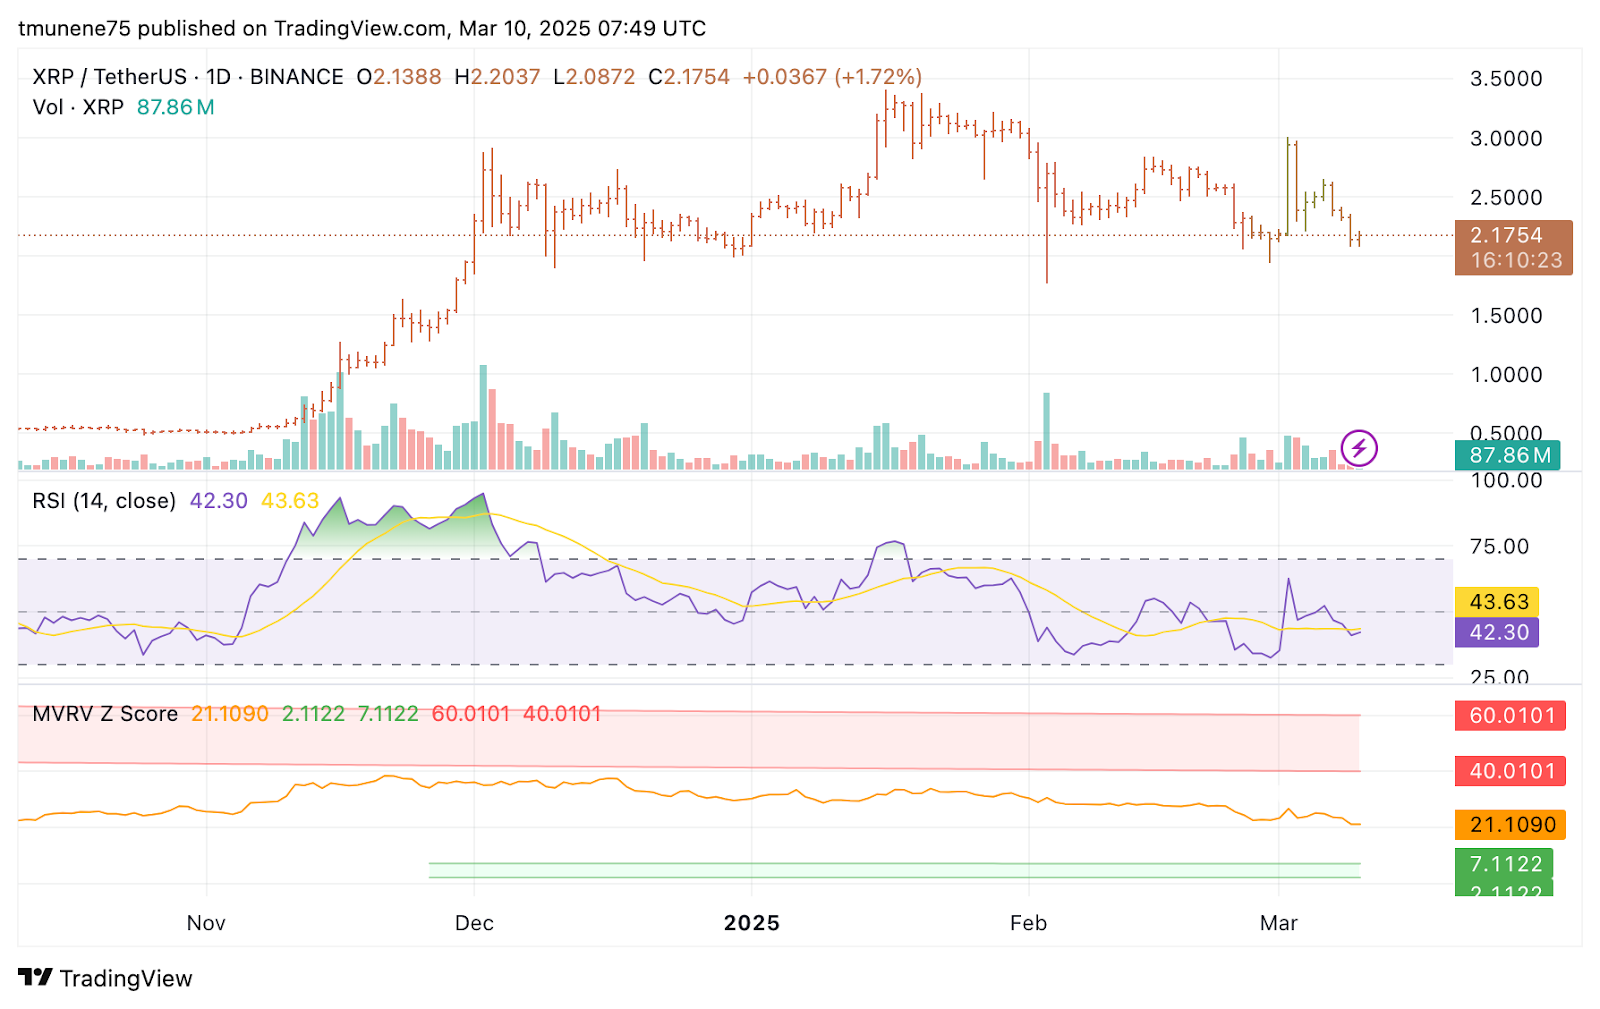
The RSI is at 42.28, while its signal line is at 43.63. An RSI below 50 suggests bearish momentum, but the market is not yet oversold. If the RSI goes above 50, a reversal could gain momentum. However, a drop below 40 may lead to increased selling pressure.
Market Value to Realized Value (MVRV) Z-Score data places XRP in a mid-range valuation, neither substantially overvalued nor undervalued. The current Z-score is 21.1090, far from the upper risk zone of 60.0101 and the lower safe zone between 2.1122 and 7.1122.
Price Forecast and Levels to Watch
XRP’s movement is dependent on key resistance and support levels. If the price holds above $2.17 and surpasses $2.20, an upward push to $2.50 could occur. In a more bullish scenario, XRP may attempt to reach $2.75 to $3.00, provided there is a surge in volume and a breakout confirmation above the RSI 50 mark.
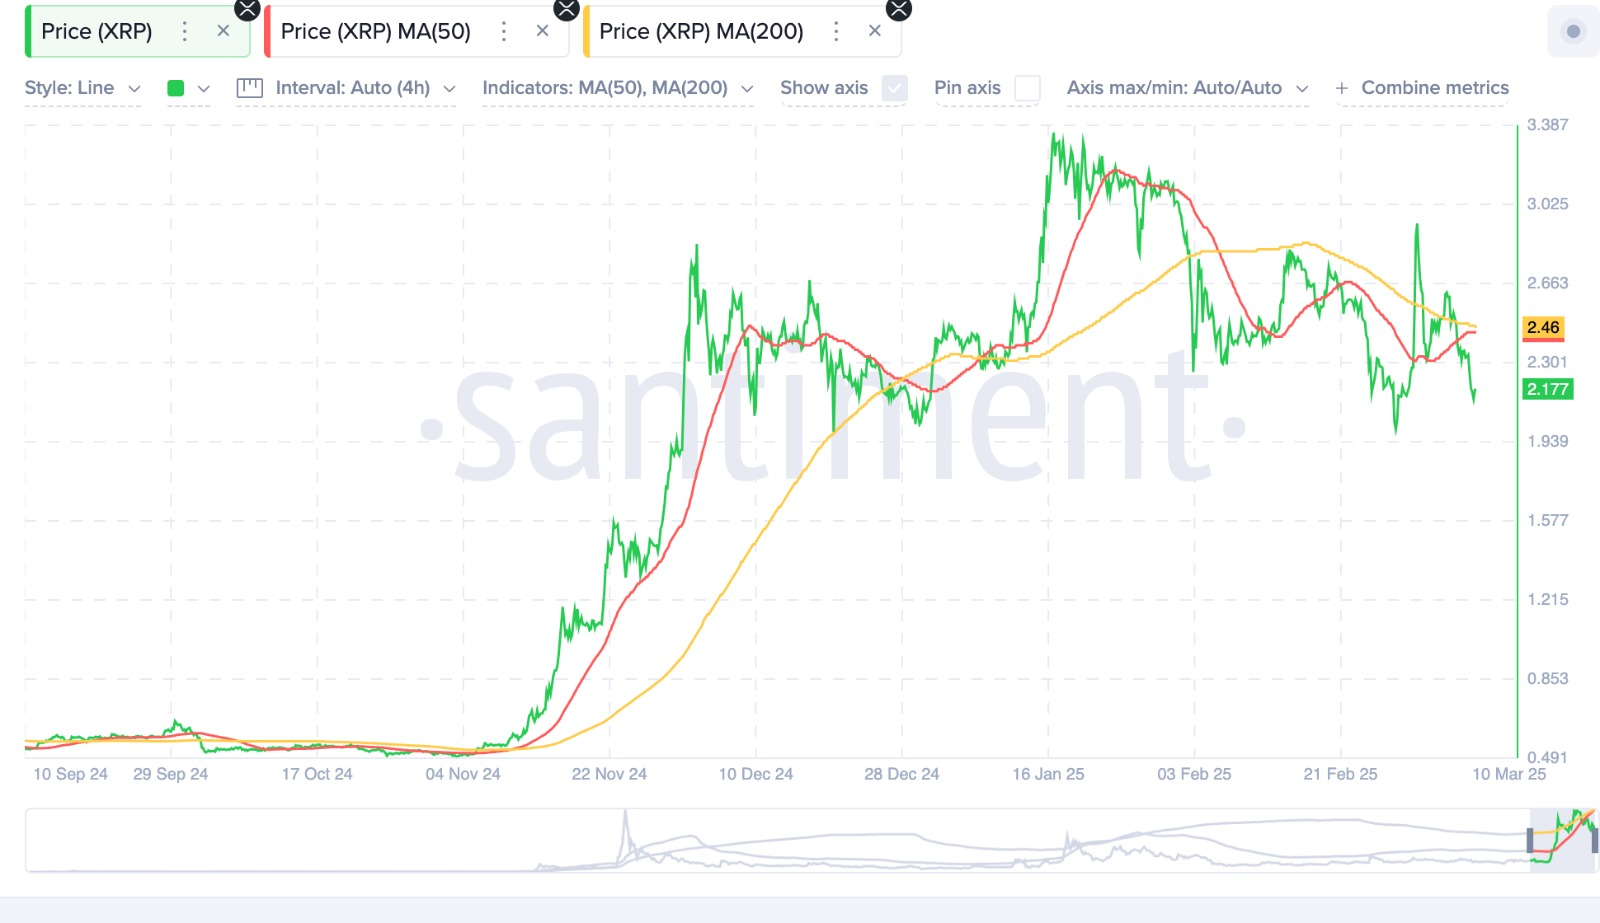
However, failure to maintain support at $2.17 could result in another drop toward $2.08. A break below $2.00 may indicate further declines to $1.80 or even $1.50 if selling pressure intensifies. The 50 day moving average at $2.46 and the 200 day moving average at $2.30 shows the importance of reclaiming these levels to shift the trend in a positive direction.
XRP’s near term movement depends on whether buyers can sustain support levels and push the price beyond resistance zones. A sustained move above $2.30 would indicate a stronger recovery, while any drop below $2.00 could lead to prolonged downside pressure.


