
- XRP holds above key support at $2.39; a move above $2.66 could trigger a rally toward $3.00, with strong buying momentum.
- Bollinger Bands suggest price stabilization, but the MVRV-Z score of 24.86 suggests potential profit-taking and short-term correction.
- XRP’s 50-day and 200-day MAs confirm bullish momentum; a break above $2.62 may push prices to $2.80–$3.38, barring a drop below $2.30.
On March 7th, at press time, XRP was trading at $2.50, a 1.16% decline over the past 24 hours. Despite the short-term dip, the asset has surged by 24.99% in the past week. However, it remains 0.79% lower compared to last month.
The market cap is at $144.93 billion, a 1.13% drop. Trading volume has increased by 54.82% in the last 24 hours, reaching $8.77 billion. The fully diluted valuation (FDV) is $250.11 billion, while the circulating supply is at 57.94 billion XRP.


XRP Market Trends and Price Movement
XRP’s price action is volatile, with a daily high of $2.6217 and a low of $2.3737. The Bollinger Bands indicate key price levels, with resistance at $2.9130, support at $2.4911, and a potential downside target of $2.0692.
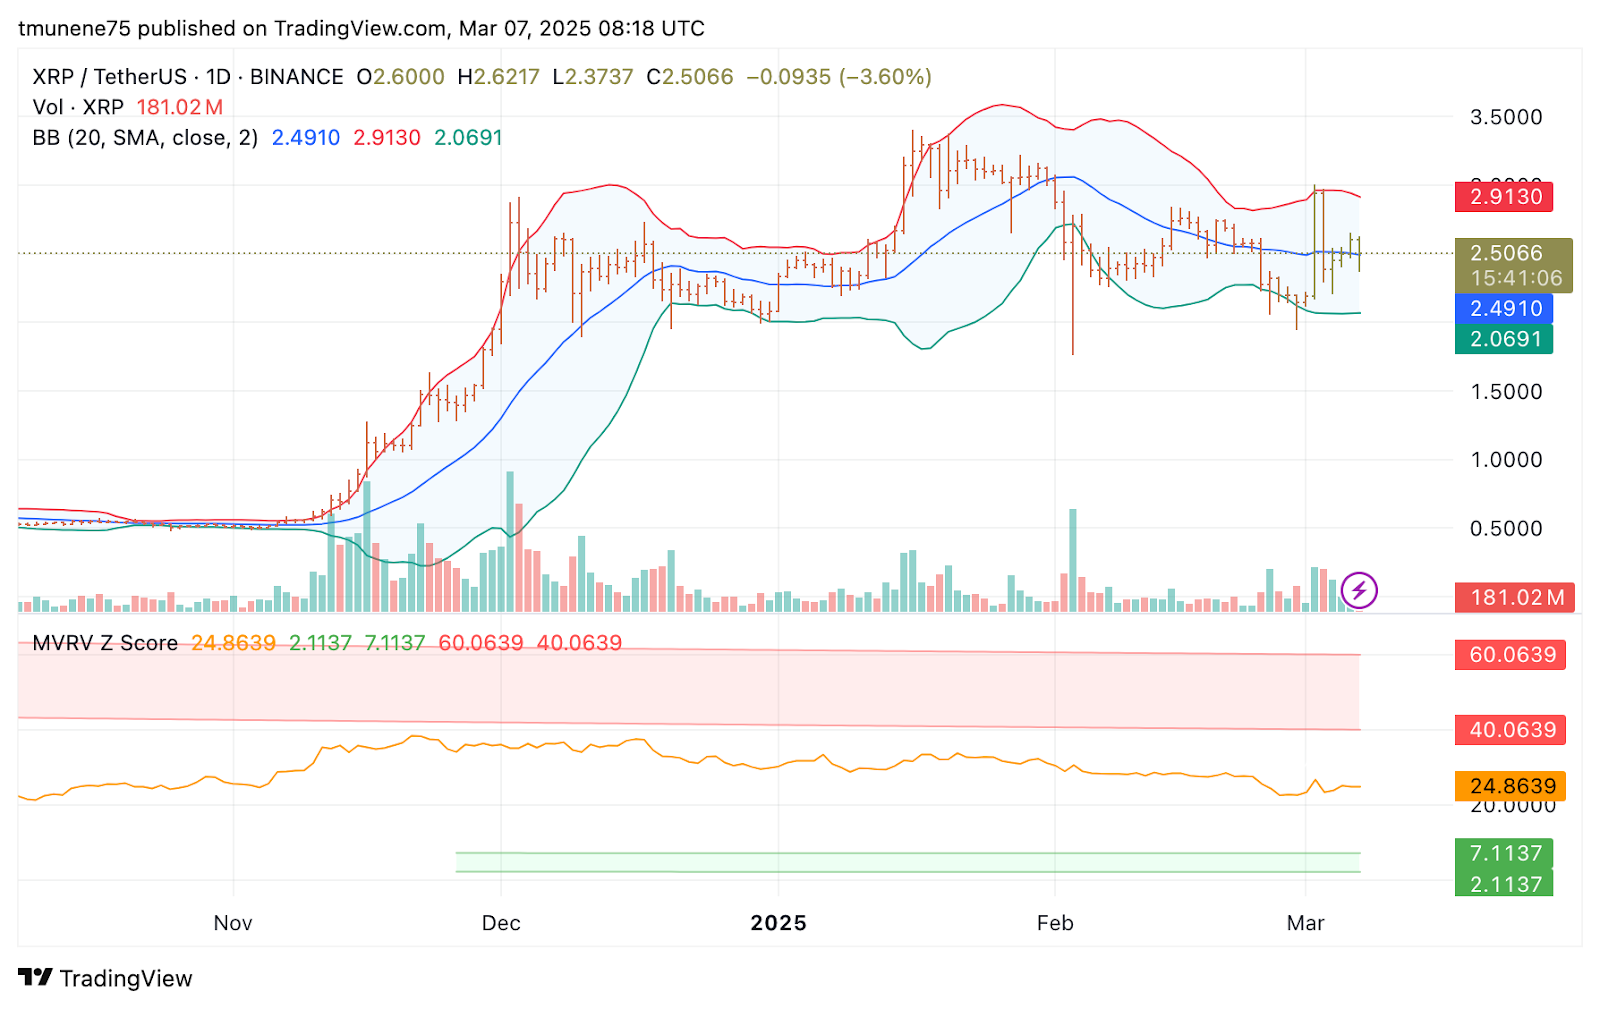
XRP is near the middle Bollinger Band, suggesting price stabilization. A break above $2.49 could push prices toward $2.91, while a failure to hold support might push the price lower. The 24 hour trading volume of 181.03 million XRP shows strong market activity.
Community sentiment is bullish, with 88% expressing optimism and only 12% holding a bearish outlook, as per data from Coinmarketcap. Additionally, the MVRV-Z score, at 24.8639, indicates XRP is in an overvalued zone. Historically, levels above 20 have led to profit taking, leading to possible price corrections.
Technical Indicators and Key Levels to Watch
XRP technical indicators suggest a potential bullish continuation. The 50 day moving average is at $2.39, while the 200 day MA is at $2.30.

The current price of $2.506 is above both moving averages, supporting the bullish outlook. A golden cross occurred in November 2024, leading to a rally toward $3.38 in early 2025. However, XRP later retraced to $1.93 before rebounding above key support levels.
Immediate resistance is at $2.66, followed by $3.00 and $3.38, which was the previous high. Support levels include $2.39, $2.30, and $1.93. If XRP remains above $2.39, it could consolidate before attempting another breakout. A sustained move above $2.66 may lead to a climb toward $3.00.
XRP Price Outlook for March 08, 2025
In a bullish scenario, XRP breaking above $2.62 could lead to a test of the $2.80 to $3.00 range, supported by increased buying pressure.
If momentum strengthens, the price might approach $3.38. On the other hand, a drop below $2.49 may push XRP toward the next support at $2.30, with further downside risks extending to $2.06.
Technical indicators suggest XRP’s price is in a consolidation phase, with potential for further upward movement if key resistance levels are surpassed. However, maintaining support at $2.39 and $2.30 is crucial for sustaining the bullish outlook.


