
- XRP holds firm above $2.145 Fibonacci zone, signaling strong bullish interest.
- Momentum indicators suggest a cautious uptrend as RSI rebounds from oversold.
- Inflows return after months of outflows, hinting at possible XRP accumulation phase.
XRP continues to command attention as it maintains a solid position above a critical trendline that has become central to its short-term direction. As of press time, 2025, XRP is trading at $2.19, with recent price activity highlighting a clean bounce from the $2.145 level.
This area is not just a Fibonacci retracement zone, but also the apex of a long-standing consolidation range. The price holding above this level signals strong buying interest and raises hopes for a continued bullish move in the near term.


Analyst Sees This Trendline as the Turning Point
Analyst CasiTrades has closely monitored this support trendline, pointing out its significance as a technical foundation. The .382 Fibonacci level at $2.145 aligns perfectly with the point of consolidation, making it the most critical price zone in the short term.
According to CasiTrades, maintaining price above this point is crucial. A failure to do so would potentially invite bearish pressure. However, XRP’s current position above the level is seen as a strong signal of bullish intent.
The next immediate challenge for bulls lies at the $2.25 resistance level. If XRP breaks and holds above this zone, analysts expect a rapid move toward $2.69, which is the next retracement level on the chart. This could potentially open the door for a larger upside breakout, building upon the impulsive structure that emerged following the correction earlier this year.
🚨This Trendline Is Everything Right Now!🚨
— CasiTrades 🔥 (@CasiTrades) June 25, 2025
I’ve been tracking this trendline support as the key level to hold and we just got a clean reaction off it. 👀This correction already reached the .382 retracement at $2.145, which also happens to be the apex of consolidation… that’s… pic.twitter.com/bA79dP1c99
Market Momentum Hints at Building Strength
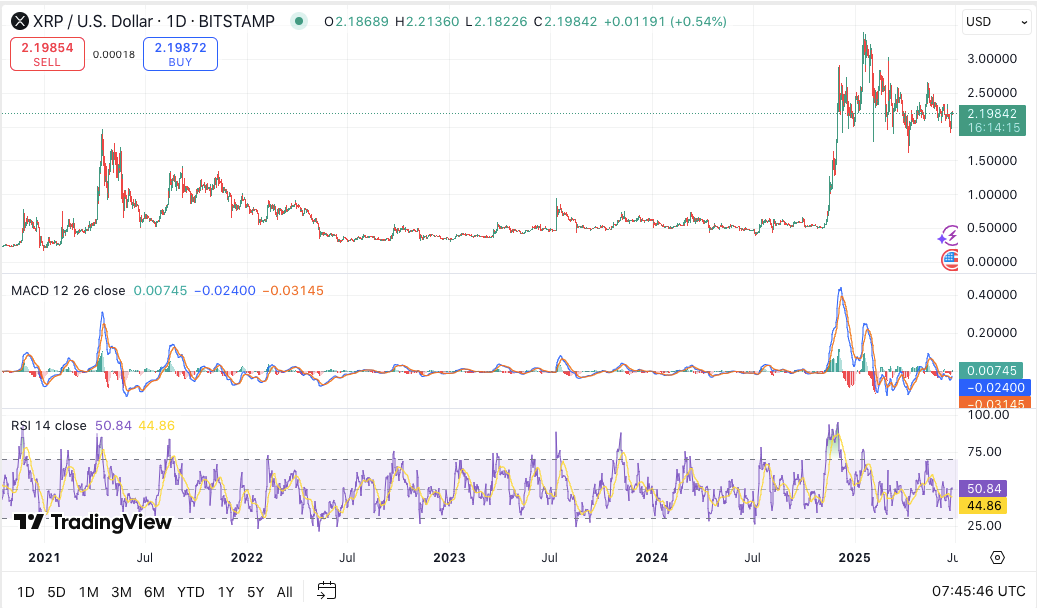
Momentum indicators are painting a cautious but optimistic picture. The MACD recently formed a bullish crossover just above the zero line, with a slightly positive histogram. This indicates early signs of momentum shifting upward, though it lacks the explosive energy seen in Q1 2025.
Meanwhile, the RSI sits at 50.92, signaling neutral conditions. It recently rebounded from oversold levels, suggesting traders are stepping in during dips. Hence, while the momentum isn’t strong yet, the indicators show growing support behind XRP’s attempt to continue its upward trajectory.
Inflow Data Signals Potential Accumulation
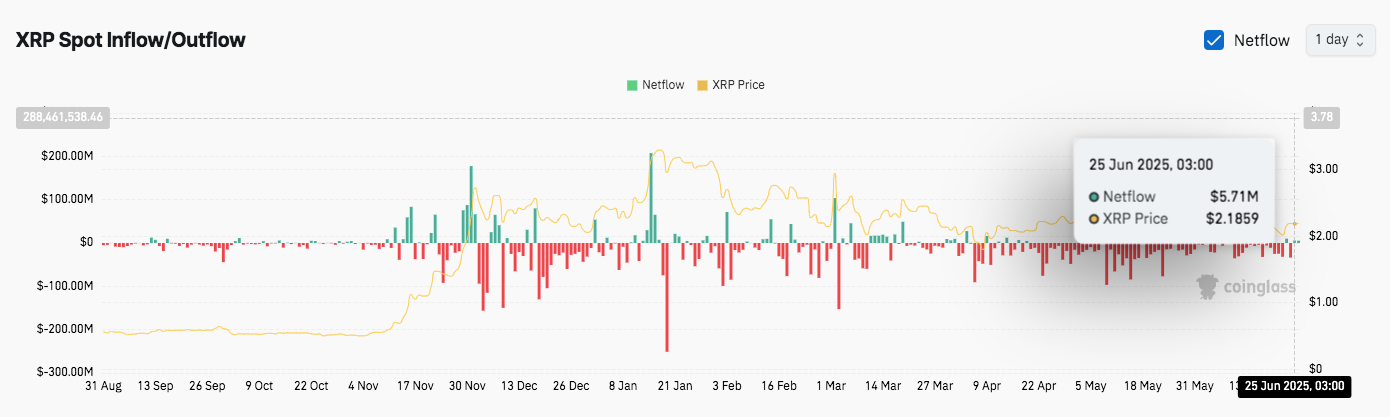
XRP’s inflow and outflow charts show a shift in sentiment. Heavy outflows dominated from December to May, peaking in late January with over $200 million exiting the market.
However, a recent inflow of $5.71 million, recorded on June 25, suggests a possible accumulation phase. If this trend continues, it could support a breakout toward previous highs near $3.78.


